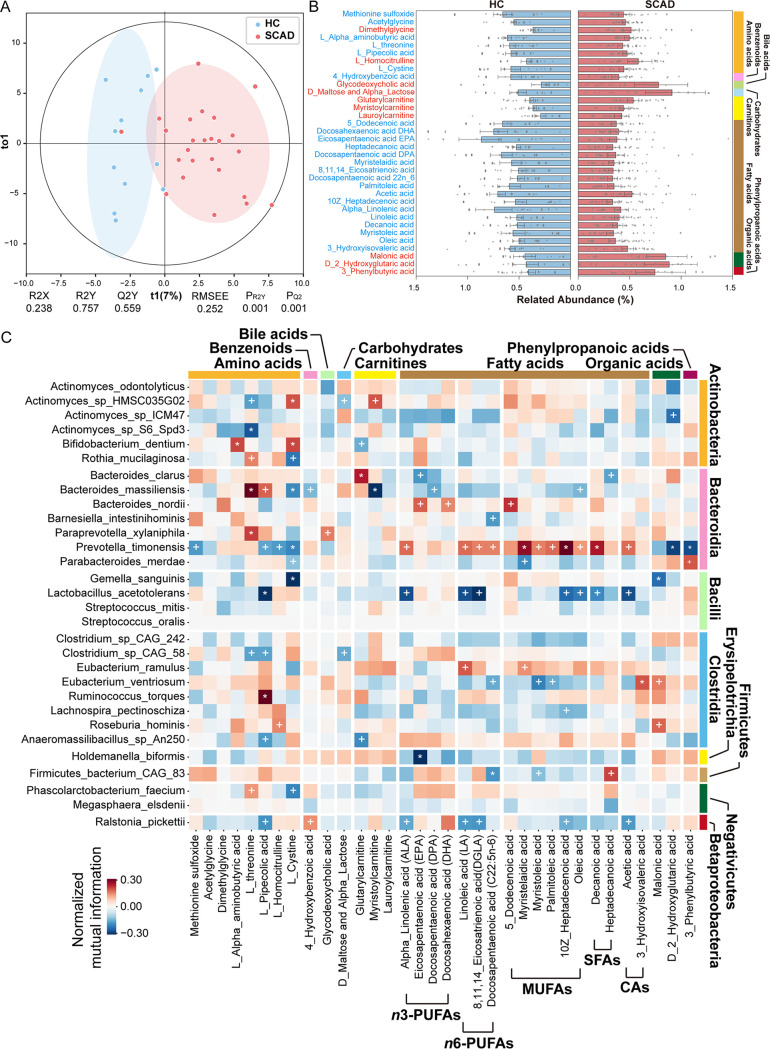
FIG 4.
Serum metabolome alterations in SCAD patients. (A) The OrthoPLSDA model of serum metabolome analysis was performed on SCAD patients and HCs (Empirical PQ2 < 0.001 and PR2Y < 0.001). (B) Relative abundances of 34 differential serum metabolites between SCAD patients and HCs (Wilcoxon signed-rank test, PFDR < 0.05). (C) The heatmap depicts relationships between the SCAD-related gut microbes and serum metabolites. The signs of change trend for each paired samples in cohort were calculated, and then normalized mutual information score was used to evaluate the association of change trends. Normalized mutual information score ranges from 0 to 1, indicating that the association between the 2 trends ranges from weak to strong. The sign of score was evaluated by the direction consistency of 2 trends. Permutation test (1000 permutations) was performed to determine P-value of correlation. * and + suggest the significance, +, P < 0.05; *, P < 0.01.

