FIG 2.
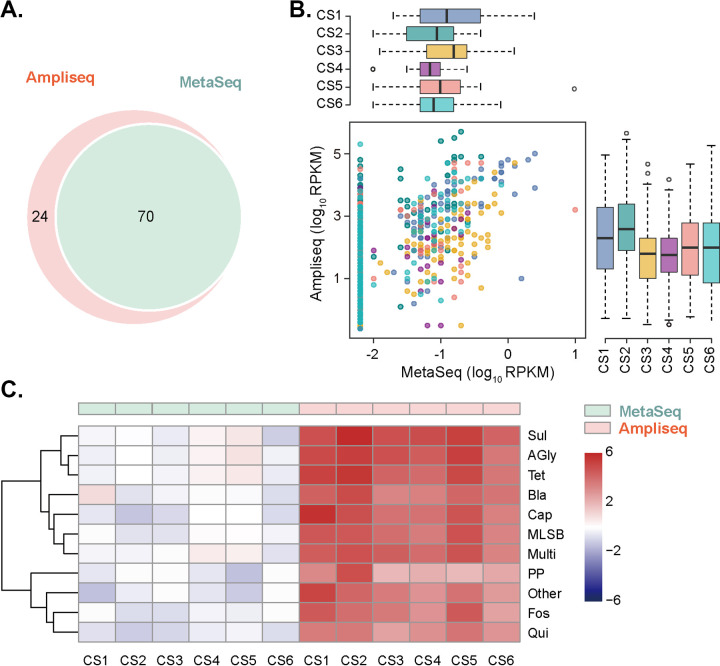
Performance summary. (A) Venn diagrams between AmpliSeq and MetaSeq of differentially detected mapping gene clusters against the custom database in this study. Each mapping gene cluster refers to a set of alleles/genes detected by a set of reads. (B) Reads per kilobase per million (RPKM) of reads mapping to each detected gene between MetaSeq and AmpliSeq. Genes only screened by AmpliSeq are shown in the initial values of the abscissa axis. (C) Abundance (RPKM) of each ARG family between AmpliSeq and MetaSeq. ARGs were classified into 10 families (Sul, sulfonamides; AGly, aminoglycosides; Tet, tetracyclines; Bla, β-lactams; Cap, chloramphenicol; MLSB, macrolide-lincosamide-streptogramin B; Multi, multidrug; PP, polypeptide; Fos, fosfomycin; Qui, quinolone). RPKM was used to normalize read counts and log-transformed to produce the heat map.

