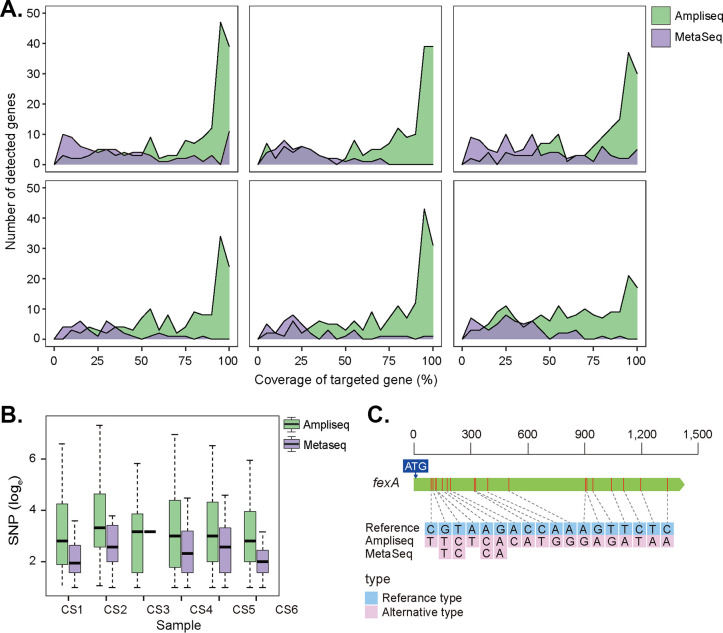
FIG 3.
Comparison of AmpliSeq and MetaSeq in gene diversity. (A) Diversity and coverage distribution of target genes. The figures show the comparison of the length coverage distribution of targeted genes between MetaSeq and AmpliSeq in each sample (n = 6). (B) Distribution was represented by the density parameter and expressed by the length coverage of each detected gene (abscissa) and the number of detected genes (ordinate). Comparison of single nucleotide polymorphisms (SNPs) distributions between MetaSeq and AmpliSeq in each sample (n = 6). Distributions were represented by the number of SNPs detected in each targeted gene in different samples. (C) Nucleotide variant depiction for the fexA gene (the full length of which is represented in the figure) across all 12 samples. SNPs identified in AmpliSeq (n = 6) and MetaSeq (n = 6) were combined, respectively, and exhibited in the figure.

