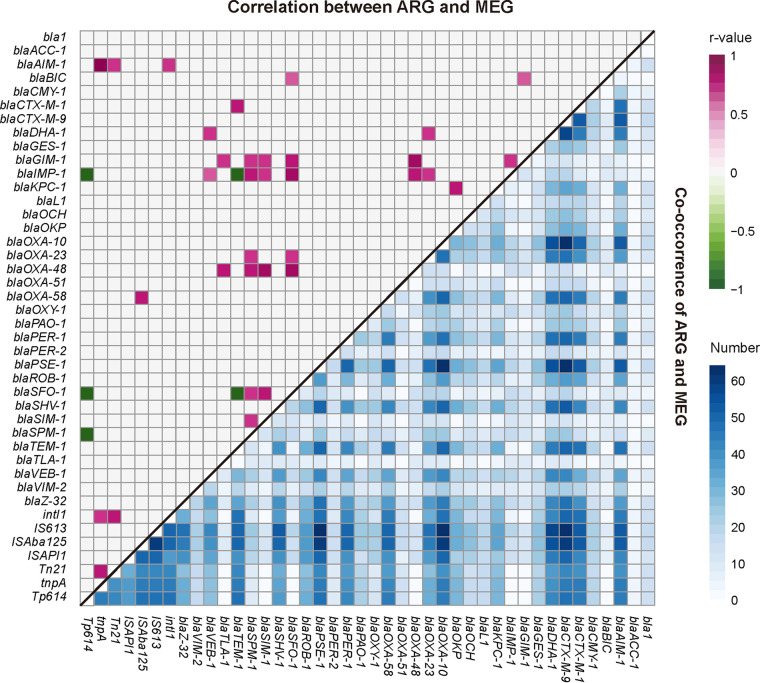
FIG 5.
Correlation (upper triangle) and co-occurrence of ARGs and MGEs (lower triangle) (n = 64). r, correlation coefficient, which was calculated by gene abundance (RPKM). Only correlations that were found to be statistically significant (the absolute value of r > 0.7 and P < 0.01) were shown (upper triangle). The low triangle exhibited a pairwise co-occurrence matrix of all ARGs and MGEs detected. The colors denote the cases when two genes coexisted.

