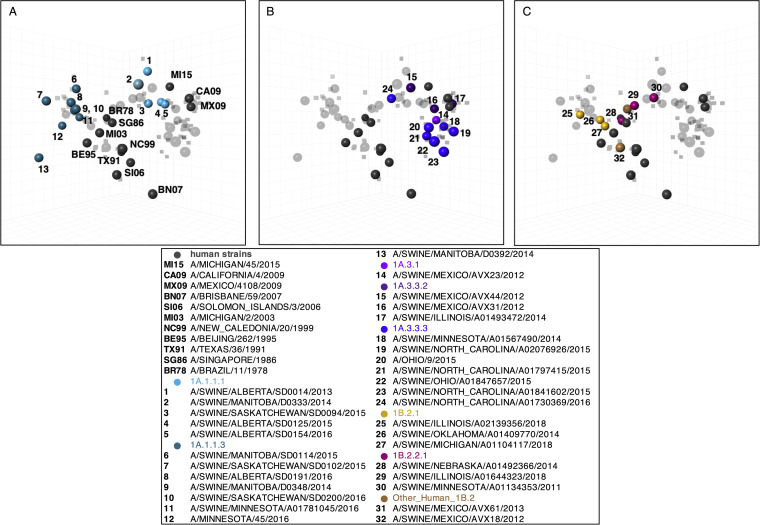
FIG 2.
Antigenic relationships between human H1N1 vaccine strains and North American swine H1 strains. The three-dimensional maps are displayed in the same rotation in all panels. Human H1N1 vaccine strains (gray) are shown in all panels but are labeled only in panel A with abbreviated strain names. North American swine H1N1 strains are split by lineages (A) 1A.1.1.x, (B) 1A.3.3.x and (C) 1B.2.x. Each sphere in the maps represents a strain, and each is colored according to the phylogenetic clade, as described in the legend. One unit of distance represents a two-fold change in the HI assay.

