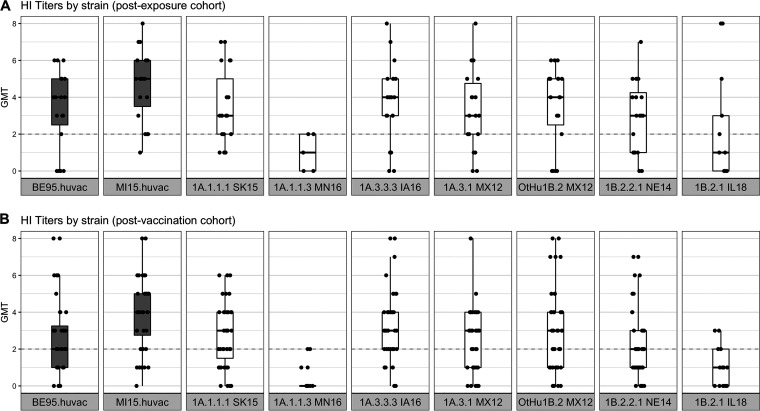
FIG 4.
Human convalescent (A) and postvaccination (B) sera geometric mean log2 hemagglutination inhibition (HI) titers against North American H1N1 swine strains. Boxplots show the median of the aggregated HI titers against H1N1 strains with the 5th and 95th percentiles and the standard deviation. Each dot represents the geometric mean titer (GMT), and the log2 (HI titer/10) of human sera is shown on the y axis against each strain (shown on the x axis). Boxplots in gray indicate the human H1N1 vaccine strains, and boxplots in white indicate the swine H1 strains. The gray dotted line indicates the minimum positive HI titer threshold (≥40 or 2). The human sera show a range of titers against most swine and human vaccine strains, with the exception of the MN16 (1A.1.1.3) and IL18 (1B.2.1) strains, to which there was little to no cross-reactivity.

