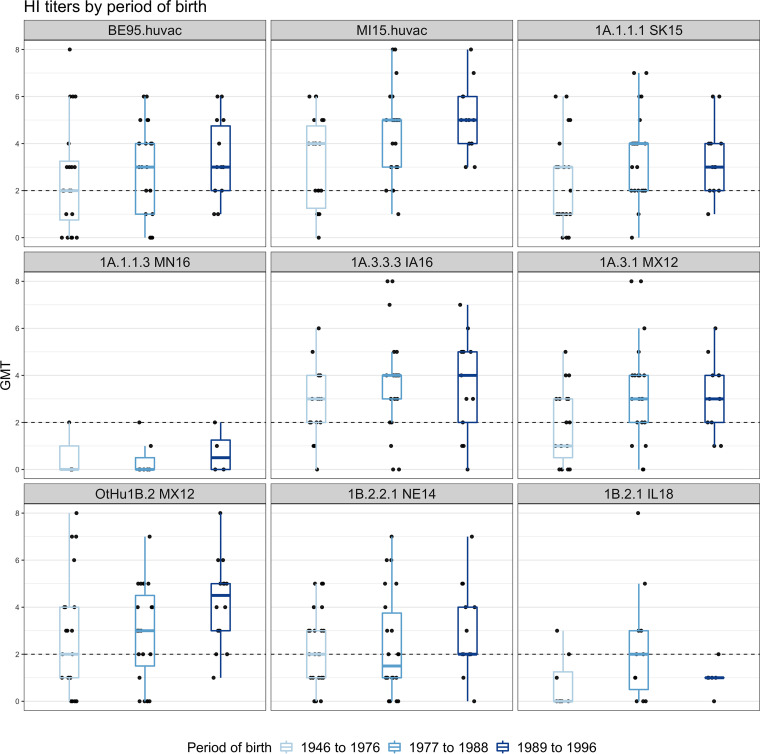
FIG 5.
Hemagglutination inhibition responses of postvaccination and postexposure human sera, stratified by period of birth, against North American H1 swine strains. Shades of light to dark blue represent the periods of birth of the human participants (1946 to 1976, 1977 to 1988, and 1989 to 1996). Boxplots show the median HI titers against H1 strains with the 5th and 95th percentiles and the standard deviation. Each dot represents the geometric mean titer (GMT) of the human sera on the y axis against each strain (shown on the x axis). The gray dotted line indicates the minimum positive HI titer threshold (≥40 or 2). No major differences were observed between the different age groups.

