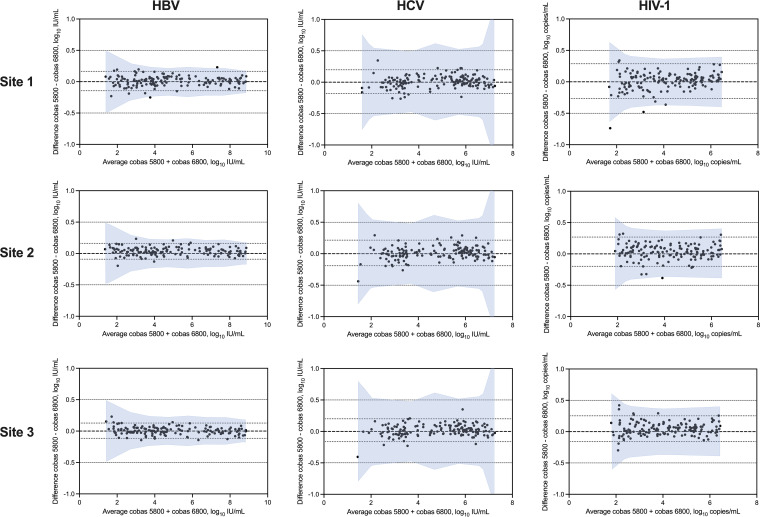
FIG 2.
Bland-Altman plots of HBV, HCV, and HIV-1 VL at the three study sites. The difference between cobas 5800 and cobas 6800/8800 results is plotted on the y axis and the average of the two results is on the x axis. The shaded area represents the allowable total difference zone based on cobas 6800/8800 reproducibility studies.

