FIG 3.
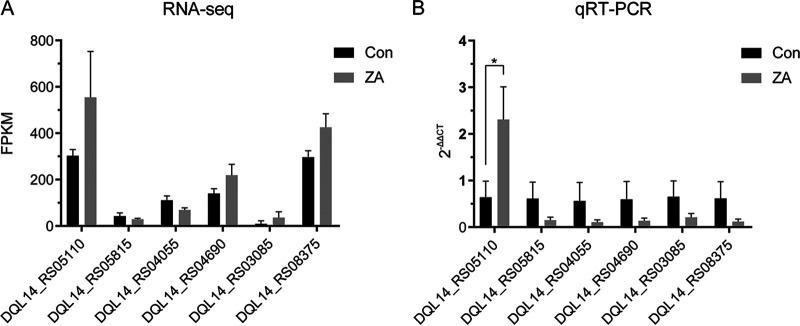
Validation of selected candidate genes using qRT-PCR. (A) Expression of 6 selected genes measured by RNA sequencing and assessed by Fragments Per Kilobase of exon model per Million mapped fragments (FPKM). Error bars indicate standard deviation. (B) Expression of 6 selected genes measured by qRT-PCR. 2-ΔΔCt method was applied to evaluate gene expression differences. Error bars indicate standard deviation. Con, control group; ZA, zinc acetate treated group. (* P < 0.05).

