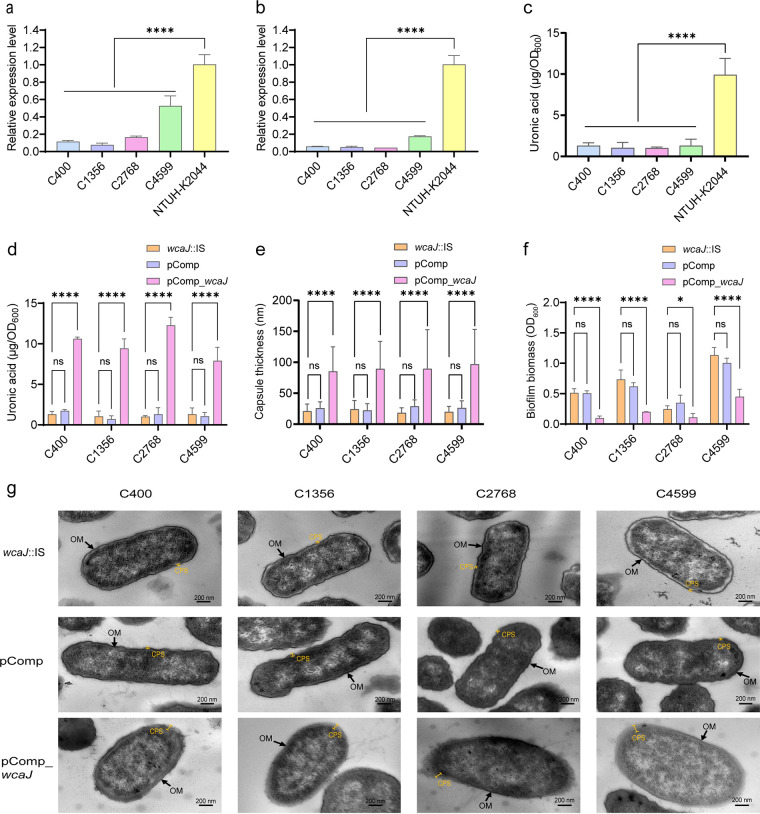
FIG 3.
Capsule-related phenotype analysis. (a and b) RT-qPCR analysis of upstream and downstream fragments, respectively, of IS insertion in the wcaJ gene region. The NTUH-K2044 isolate was used as a reference. (c) The uronic acid contents of C400, C1356, C2768, and C4599 isolates were compared to that of NTUH-K2044. (d) Uronic acid production was significantly increased in wcaJ-complemented isolates compared to that in the parent isolates with IS insertion in wcaJ (wcaJ::IS). (e) Capsule thickness was determined by measuring five different sites for 10 cells per isolate. The data represent the average of 50 replicates ± standard deviations (SD). (f) Biofilm formation comparison between wcaJ::IS and wcaJ-complemented counterparts. Six replicates were performed per isolate. (g) Representative TEM images of wcaJ::IS, pComp, and wcaJ-complemented counterparts. Arrows indicate the outer membrane (OM). Capped lines mark the capsule (CPS). Each data point represents three replicates (n = 3), except for those in panels e and f. Data are presented as the mean ± SD. *, P < 0.05; ****, P < 0.0001; ns, not significant.

