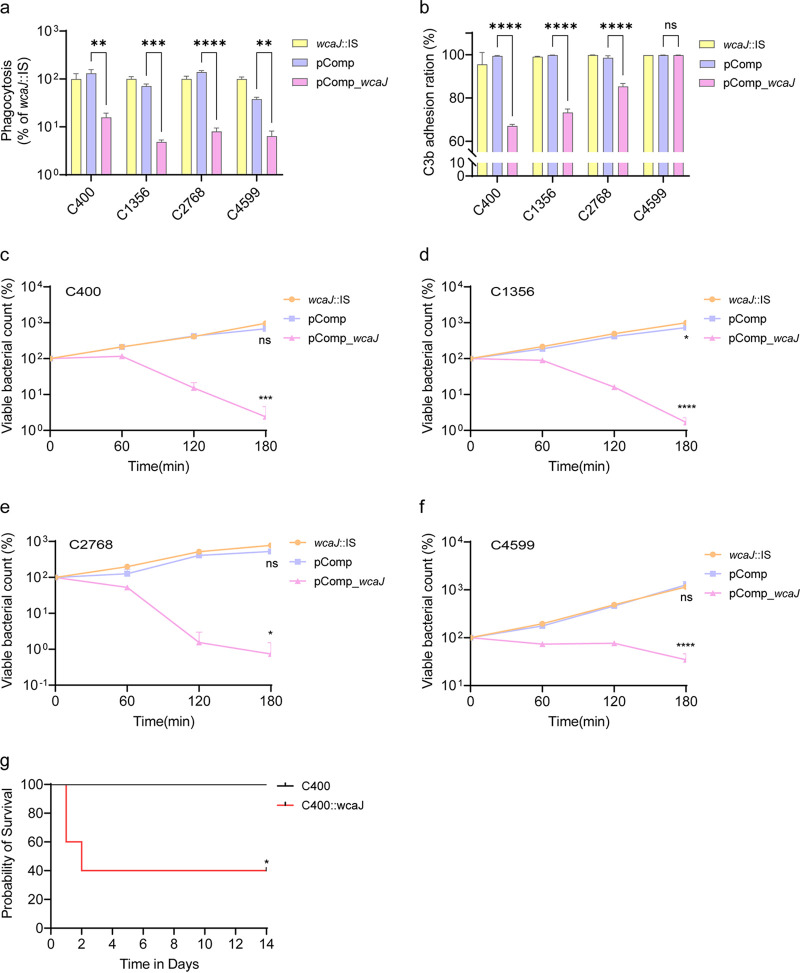
FIG 5.
Virulence-related phenotype analysis. (a) Phagocytosis by RAW 264.7 cells. The values shown were calculated as a ratio of the intracellular bacteria to total bacteria and normalized to that of wcaJ::IS isolates (n = 3). Data were analyzed by one-way ANOVA. Data are presented as the mean ± SD. (b) Flow cytometric analysis of C3b deposition on the surfaces of isolates (n = 3). Data were analyzed by one-way ANOVA. Data are presented as the mean ± SD. (c to f) Serum killing results for C400, C1356, C2768, C4599, and their counterparts. Samples were taken at 0, 60, 120, and 180 min, and each isolate was tested three times. Isolates were compared by two-way ANOVA (overall P < 0.0001), and Tukey’s multiple-comparison test at 180 min showed significant differences. (g) Survival of BALB/c mice. The mice were challenged with 1.96 × 10⁶ CFU of the C400 isolate and 1.97 × 10⁶ CFU of its wcaJ-complemented isolate. The mortality of mice was observed over 14 days. The significance was calculated using the log rank (Mantel-Cox) test. *, P < 0.05; ****, P < 0.0001; ns, not significant.

