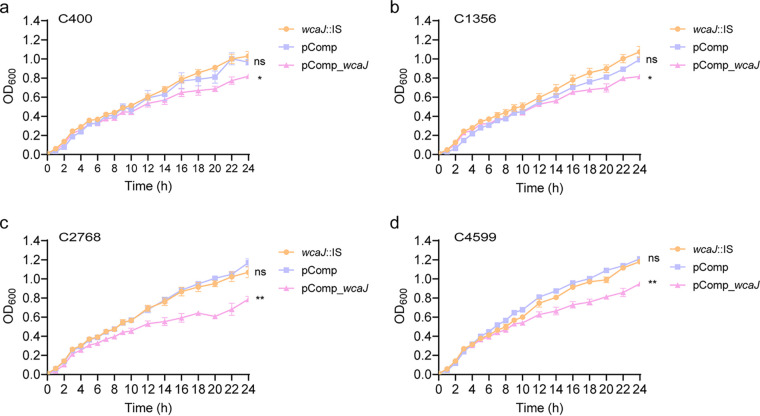
FIG 6.
Growth curve of C400, C1356, C2768, and C4599 isolates and their corresponding isogenic derivative strains pComp and pComp_wcaJ. (a) C400; (b) C1356; (c) C2768; (d) C4599. Data were analyzed by two-way ANOVA (overall P < 0.05), and Tukey’s multiple-comparison test at 24 h showed significant differences. *, P < 0.05; **, P < 0.01; ns, not significant.

