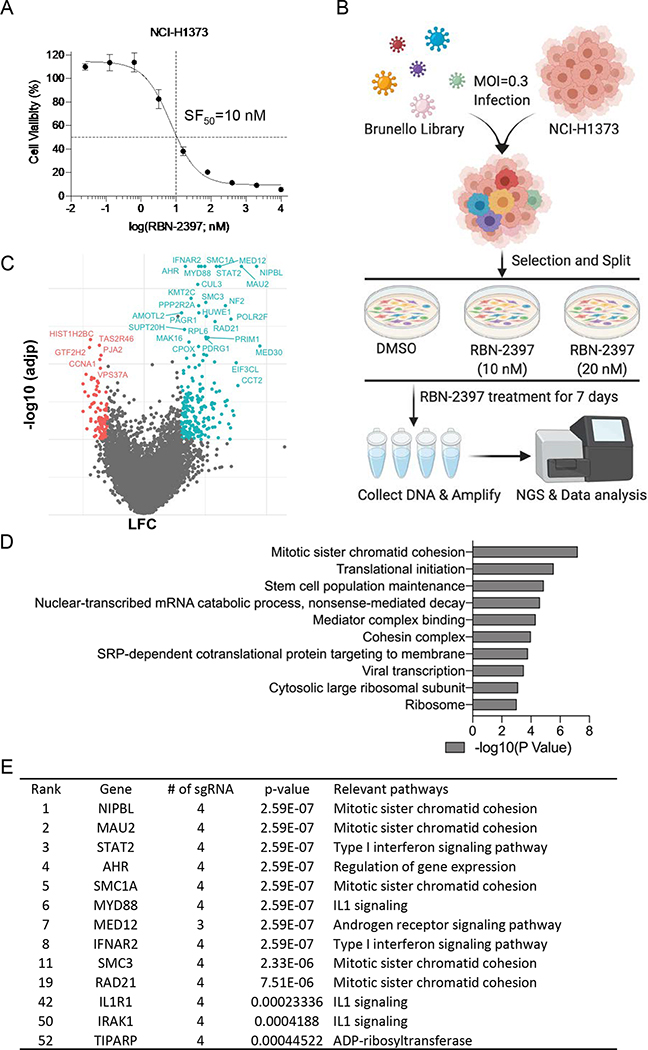
Fig. 1. Whole-genome CRISPR-Cas9 screen in NCI-H1373 cells.
A, Survival curve of NCI-H1373 cells exposed to increasing concentration of RBN-2397. Data shown as mean values ± SD; n = 6. B, Schematic of the workflow for CRISPR screens performed in NCI-H1373. C, Volcano plot comparing sgRNA counts in DMSO vs RBN-2397(10 nM) CRISPR treatment arms. x axis is gene-level LFC (median of LFC for all sgRNAs per gene, scaled). y axis is the −log10(adjp) as calculated by MAGeCK. Genes enriched (LFC > 0.6 and −log10(adjp) > 2,) and depleted (LFC < 0.6 and −log10(adjp) > 2) in the RBN-2397 treated cells are indicated in cyan and red, respectively. D, The top 10 Gene Ontology (GO) terms of significantly enriched hits. E, Top hits ranked by MAGeCK.

