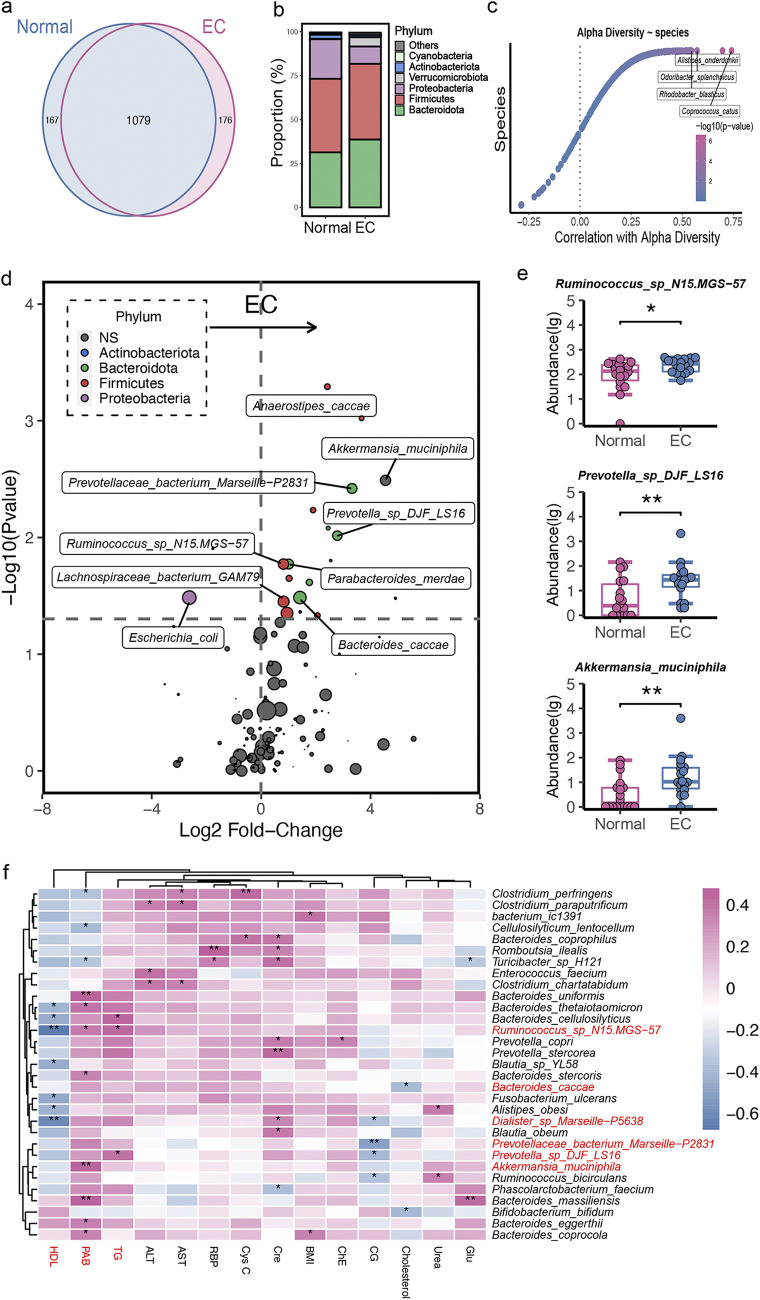
FIG 1.
Gut microbial alterations in normal and EC individuals. (a) Venn diagram of the observed OTUs in normal and EC groups. (b) Bacterial profile at the phylum level. (c) Correlation between alpha-diversity and gut bacteria. (d) Volcano plots showing the changes in gut bacteria between normal and EC subjects at the species level. Significantly different taxa are colored according to the phyla as indicated in the key. The size of the plots indicates the abundance of the gut bacteria. (e) The absolute abundance of species in the indicated groups (a two-tailed Wilcoxon test was used to determine significance in normal and EC individuals; *, P < 0.05; **, P < 0.01). (f) Spearman’s rank correlation between the top 30 species and 14 clinical indices (only species that correlated with at least one clinical index at a P of <0.05 [*] or a P of <0.01 [**] are shown).

