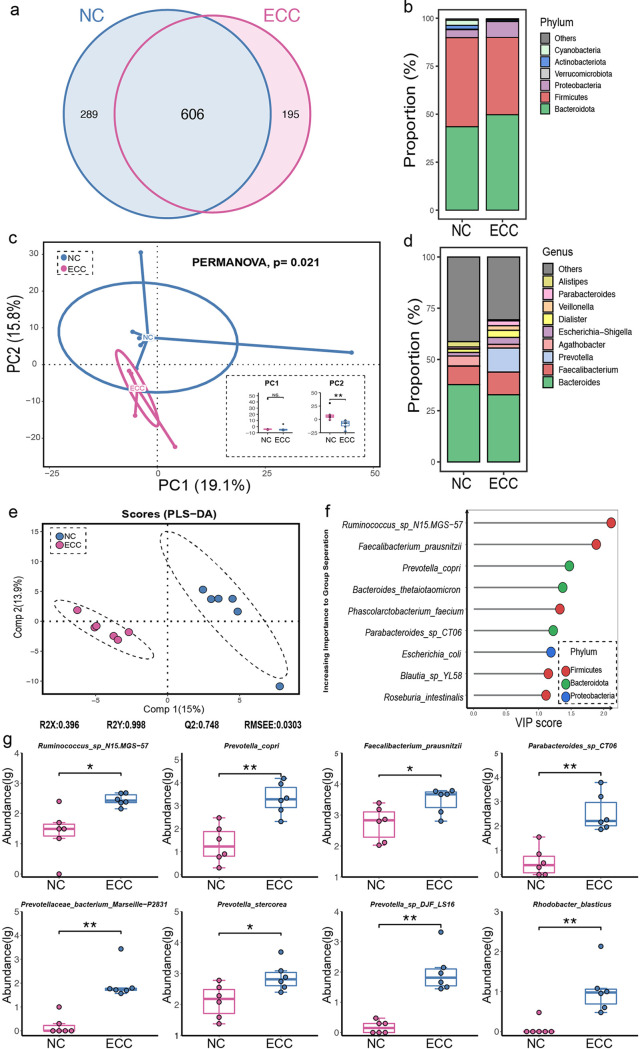
FIG 3.
Construction and biomarker species in EC patients of normal weight. (a) Venn diagram of the observed OTUs in NC and ECC individuals. (b) Comparison of the microbiota profiles of NC and ECC groups at the phylum level. (c) Beta-diversity between two groups. (d) Comparison of the microbiota profiles of NC and ECC groups at the genus level. (e) Clustering analyses of PLS-DA score plot of species abundance in samples from individuals from NC (blue points) and ECC (red points) groups. (f).VIP scores of PLS-DA. VIP scores were used to rank the discriminating powers of different taxa between the NC and ECC groups (VIP score of >1). (g) Abundance of significantly changed species in NC and ECC individuals (two-tailed Wilcoxon test; *, P < 0.05; **, P < 0.01).

