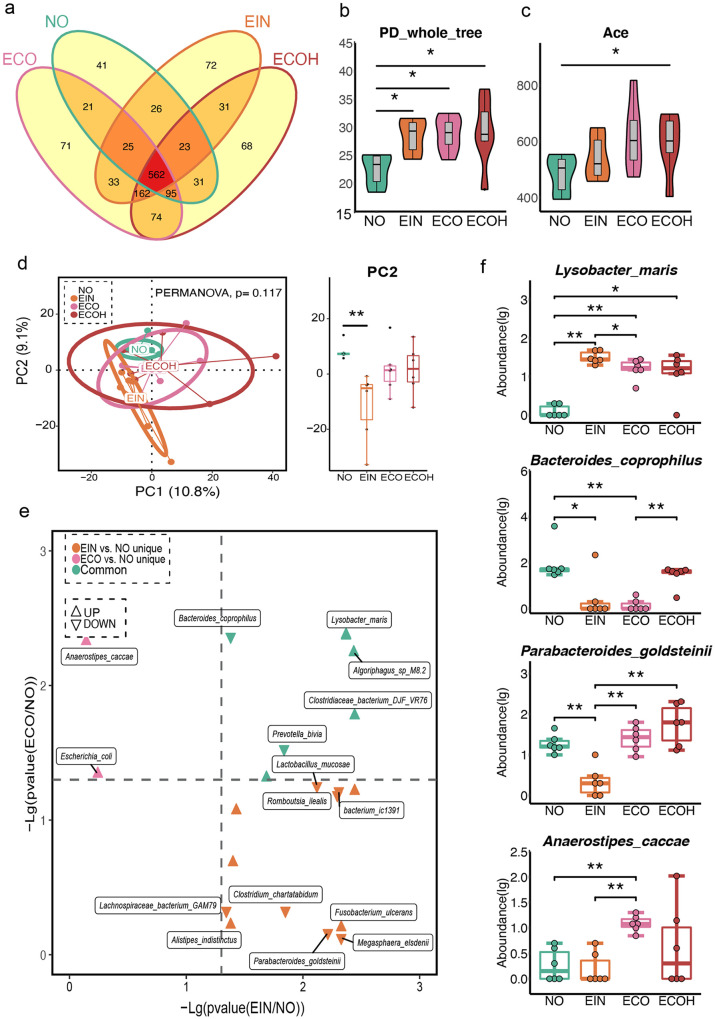
FIG 4.
Distribution of intestinal microbiome in overweight subjects. (a) Venn diagram of the observed OTUs in NO, EIN, ECO, and ECOH groups. (b to d) Comparison of alpha- and beta-diversity among four groups. (e) Volcano plots of differential bacterial abundance in EIN, ECO, and the two groups together in comparison to the NO group. (f) Significantly different gut bacteria among four groups (two-tailed Wilcoxon test; *, P < 0.05; **, P < 0.01).

