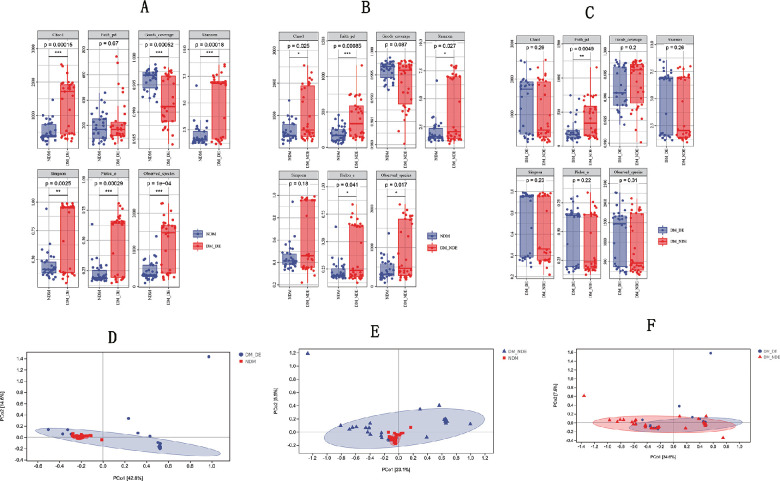
Figure 2.
α-Diversity index analysis of the three study groups: (A) NDM versus DM-DE. (B) NDM versus DM-NDE. (C) DM-DE versus DM-NDE. Principal coordinate analysis of the three study groups: (A) NDM versus DM-DE (R2 = 0.352383; P = 0.001). (B) NDM versus DM-NDE (R2 = 0.180094; P = 0.001). (C) DM-DE versus DM-NDE (R2 = 0.041521; P = 0.067).

