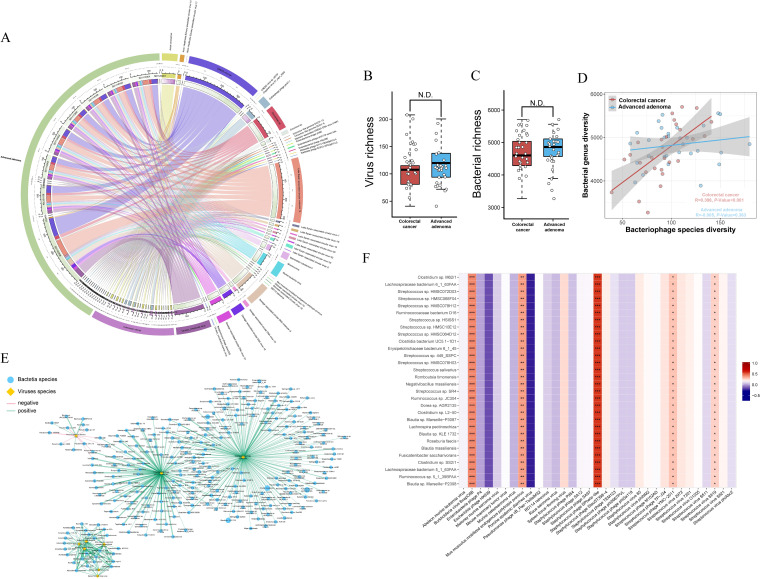
FIG 4.
Differential virus analysis between CRC and AA patients. Significant difference analysis in virus diversity (A) and bacterial community richness (B) between CRC and AA patients. The corresponding relationship between CRC and AA groups and species at the virus species level and the proportion of different species in each group and the proportion of each group in different species (C). In the correlation heatmap between differential viruses and differential bacteria (D), x and y axes are the 11 PathSeq differential viruses and the top 30 differential bacteria in abundance, respectively. The values are shown in different colors, and the legend on the right is the color range of different R values. In the correlation network between differential viruses and differential bacteria (E), circular nodes represent differential bacteria, rhombus nodes represent differential viruses, different colors are used to distinguish between differential viruses and differential bacteria, and the size of nodes represents the abundance. The green line indicates a positive correlation, and the red line indicates a negative correlation. The thicker the line is, the higher the correlation is.

