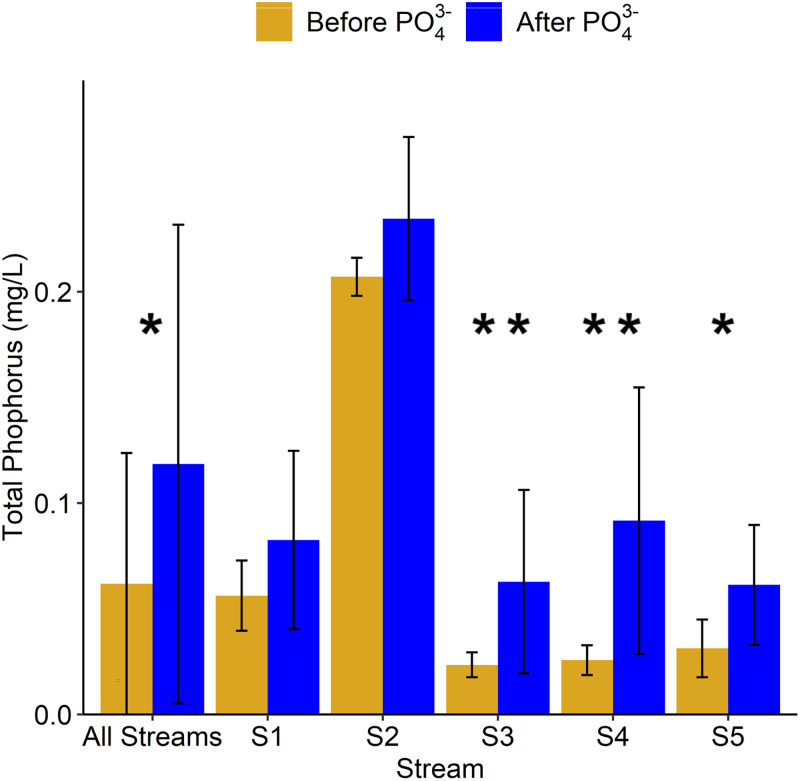
FIG 2.
Total phosphorus concentration (average ± the standard deviation) in each urban stream before and after PO43– addition into the DS. Statistical significances between concentrations were analyzed between samples collected before and after PO43– addition into the distribution system (**, P < 0.01; *, P < 0.05).

