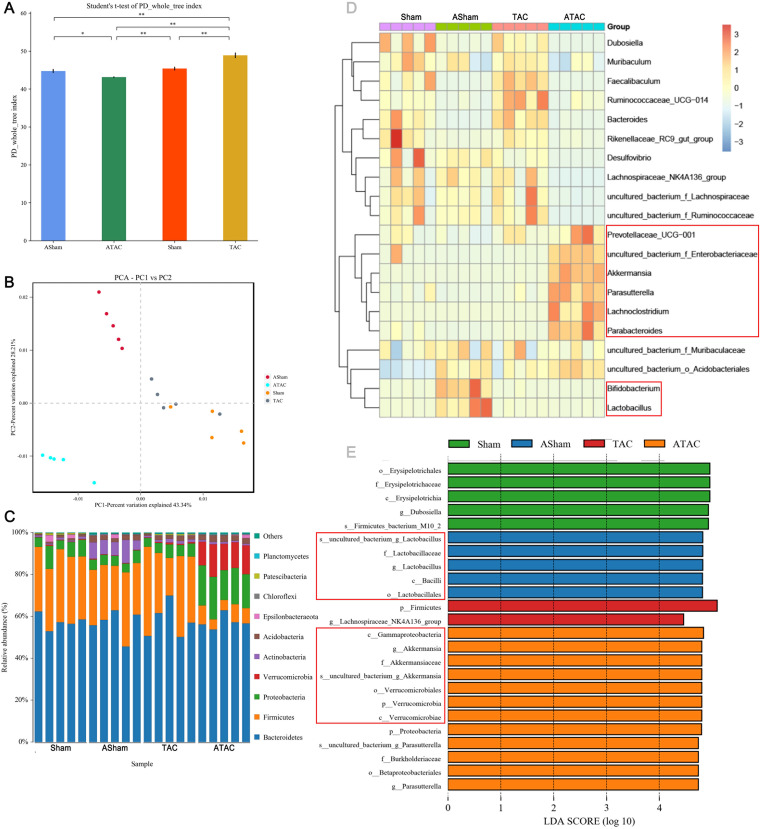
FIG 2.
Characterization of the gut microbiota in sham-operated and TAC-operated mice with or without microbiota clearance. The feces of five mice from each group were randomly selected, and the microbiota composition of the small intestine contents was analyzed by 16S rRNA gene sequencing. (A) Shannon index (α diversity). (B) Principal-coordinate analysis (PCoA) plot (β diversity). (C) Composition of abundant bacterial phyla. (D) Linear discriminant analysis (LDA) effect size showing the most significantly differentially abundant taxa enriched in the microbiota from the sham (sham), ABX+sham (ASham), TAC (TAC), and ABX+TAC (ATAC) groups. (E) Heatmap of the abundances of bacteria at the genus level.

