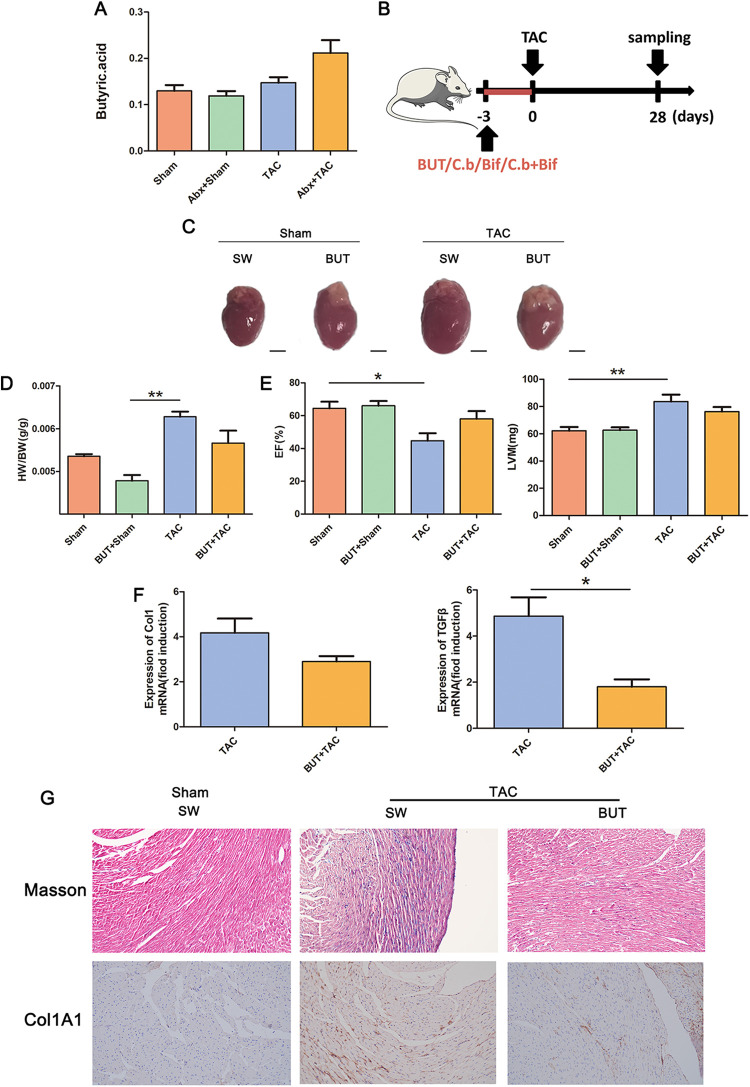
FIG 7.
Sodium butyrate ameliorated cardiac fibrosis. (A) Serum levels of butyric acid in mice in each group. (B) Experiment-specific operation time flow chart. (C) Whole hearts for each group (n = 7). (D) Heart mass-to-body weight ratio of mice in each group. Representative images are shown. (E) Ejection fraction and left ventricular weight obtained by cardiac ultrasound in each group of mice. (F) qPCR analysis of Col1 and TGF-β expression in the heart tissue of mice in each group. The levels of Col1 and TGF-β in tissues from the sham group were assigned a value of 1.0. Different mRNA expression levels among the TAC, BUT+TAC, and sham groups were compared by one-way ANOVA. *, P < 0.05. (G) Masson staining and COL1A1 immunohistochemistry results of sham-operated (sham) or TAC mouse (TAC) hearts were obtained after intraperitoneal injection of sodium butyrate (BUT+sham, BUT+TAC) Magnification, ×200. Representative images are shown.

