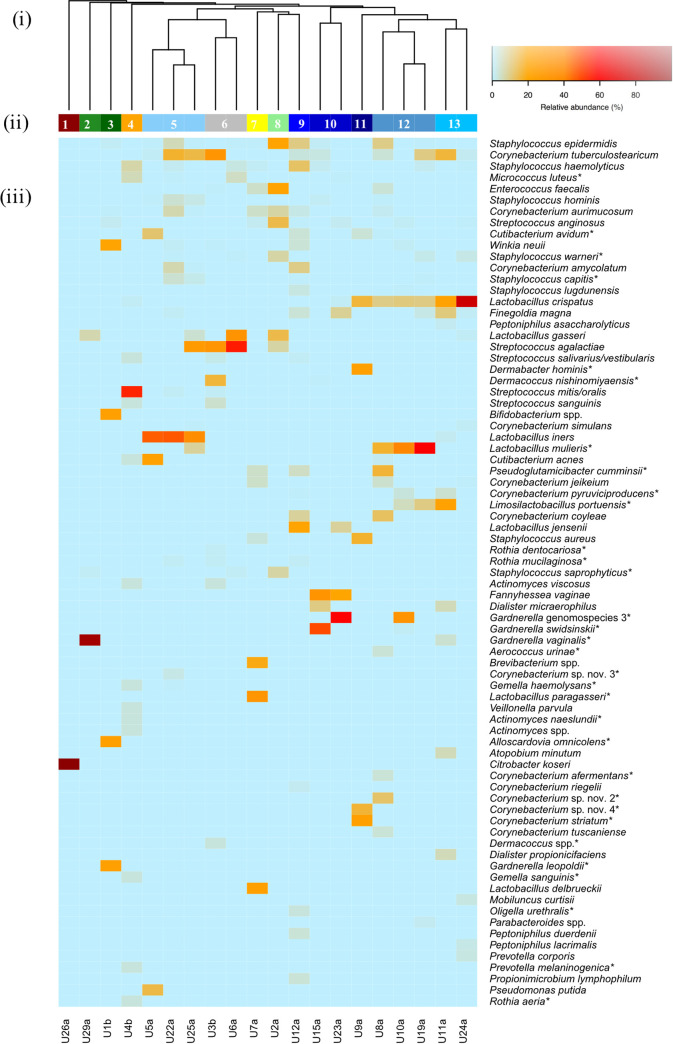
FIG 1.
Species-level community structure types of the FUM by culturomics. (i) Hierarchical clustering of Bray-Curtis dissimilarity distance matrices on the relative proportions of CFU/mL within individual urine samples. (ii) Bars below the dendrogram denote community structure types. (iii) Heatmap of RA of bacterial species within each urinary microbiome. Only species that are at least 1% abundant in at least one sample are shown in order of decreasing prevalence (from top to bottom). Asterisks denote detection only by culturomics and not by amplicon sequencing.

