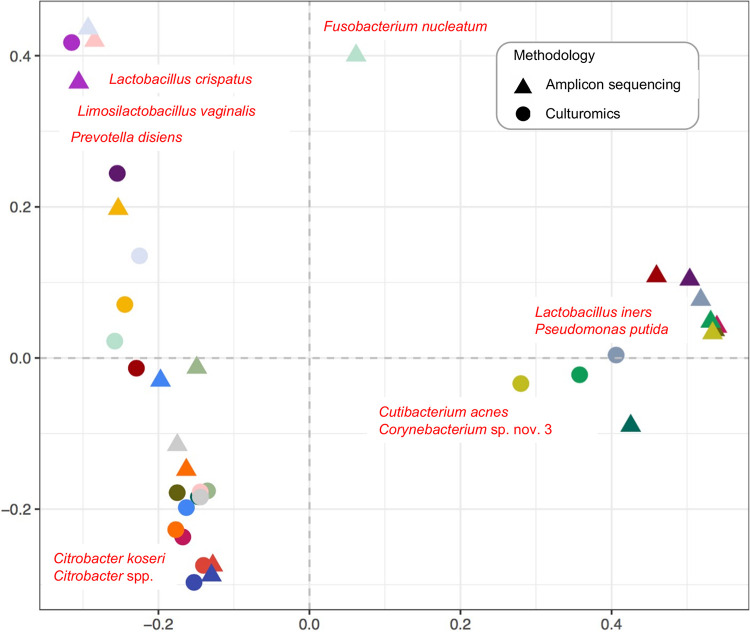
FIG 3.
Biplot of the principal coordinate analysis (PCoA) based on the species-level Bray-Curtis dissimilarity matrices. Two-dimensional distances identify dissimilarities between bacterial community structures detected by culturomics and amplicon sequencing. The biplot, based on weighted average of the species scores, shows the top 10 species with the largest contributions to dissimilarities. Same colors indicate the same sample.

