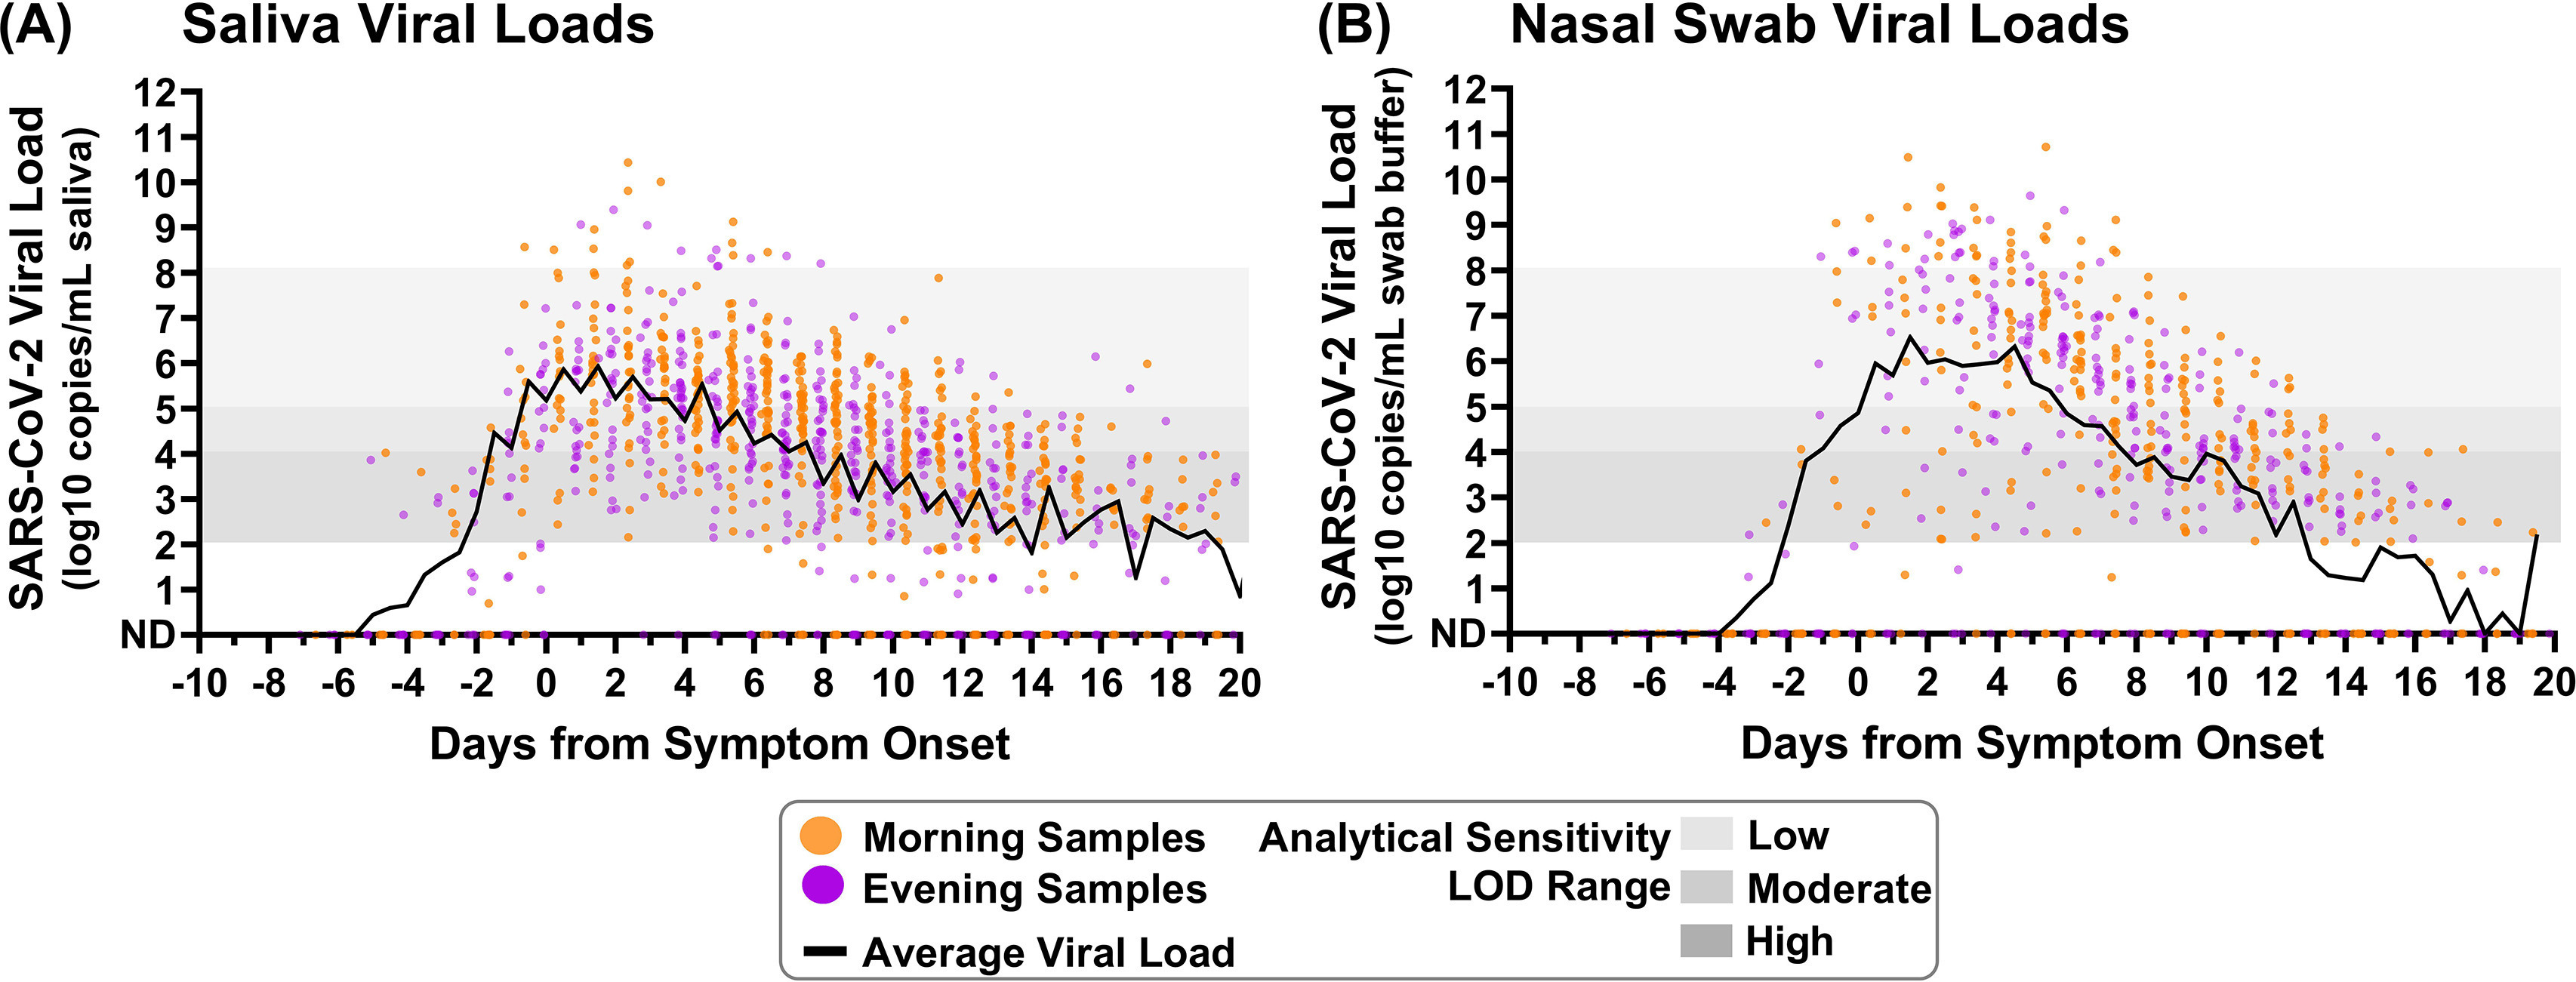
FIG 1.

Saliva and nasal swab specimens collected in the morning and evening through the course of infection demonstrate differences in SARS-CoV-2 viral load. Black lines on each plot indicate the average viral load for each daily morning or evening specimen collection window. (A) Saliva specimen viral load (SARS-CoV-2 N1 copies/milliliter of saliva) as measured by RT-qPCR is plotted relative to symptom onset for 1,194 specimens. (B) Nasal swab specimen viral load (N1 copies/milliliter of swab buffer) as measured by RT-qPCR is plotted relative to symptom onset for 661 specimens. Specimens were designated morning (orange) if collected between 4 a.m. and 12 p.m. or evening (purple) if collected between 3 p.m. and 3 a.m. ND, not detected. Additional specimen details are provided in the supplemental material.
