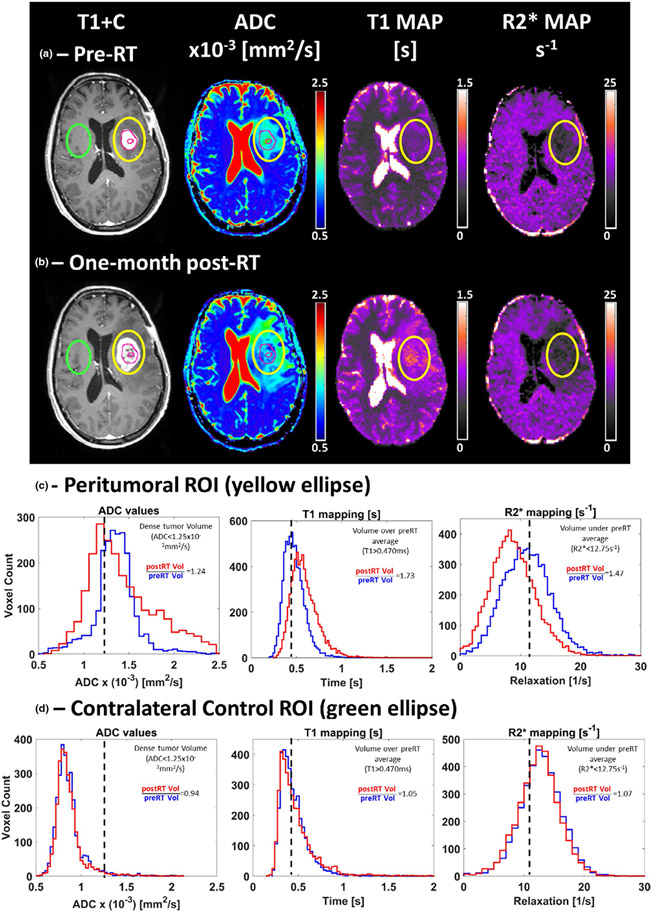
FIGURE 3.
An example of multiparametric magnetic resonance imaging (mpMRI) containing T1 post-contrast (T1+C), apparent diffusion coefficient (ADC), T1, and R2* maps estimated from data acquired pre (a) and one-month post-RT (b) from a 58-year-old woman with partially resected glioblastoma of the left temporal lobe. The DWI images used to estimate the ADC maps and the T1+C were acquired on a 3T Skyra (Siemens, Erlangen, Germany) clinical scanner and the data used to estimate T1 and R2* maps were obtained on a 0.35 T MRIdian (ViewRay, Cleveland, OH) combination MRI and RT system. The multiparametric analysis was performed for voxels within two different regions of interest (ROI). The yellow ellipse highlights the peritumoral ROI (c). The resection cavity and tumor original contrast-enhanced volume are highlighted by the inner and outer magenta circles within the peritumoral ROI, respectively. A contralateral control ROI (green ellipse) was also analyzed by the multiparametric approach (d) in order to provide a measurement of each parameter’s stability across different time points

