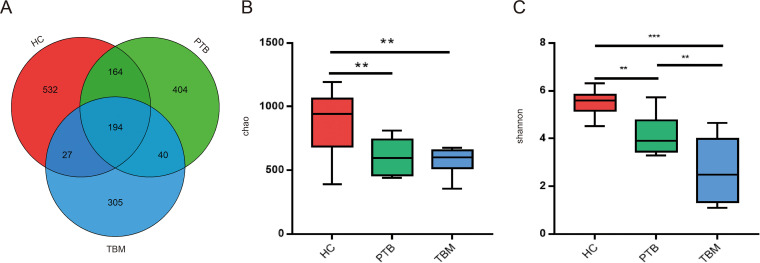
FIG 2.
Gut microbial diversity differences among TBM patients, PTB patients, and healthy individuals. (A) Venn diagram showing shared and unique operational taxonomic units (OTUs) identified in fecal samples from the HC, TB, and TBM groups. (B and C) α-Diversity was assessed using Chao (B) and Shannon (C) indexes. Results are shown as the mean ± SEM as determined using the Kruskal-Wallis test. ****, P < 0.0001; **, P < 0.01. HC, healthy control; PTB, patients with pulmonary tuberculosis; TBM, patients with tuberculous meningitis.

