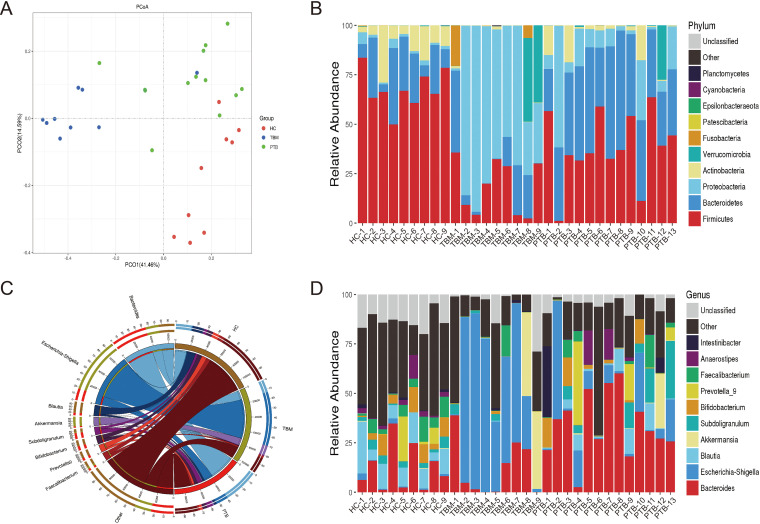
FIG 3.
Gut microbiota composition of TBM patients, PTB patients, and healthy subjects. (A) Principal-coordinate analysis (PCoA) based on weighted UniFrac distance analysis showing PCoA distributions along the principal-component (PCO) axis for the three subject groups. Percentages marked on the horizontal and vertical axes are the contributions of the principal coordinate to data differences for the sample matrix. (B) Stack diagram of relative phylum-level gut microbiota abundances in the HC, PTB, and TBM groups. (C) Circos plot showing genus-level groupings, whereby the top 10 genera in all samples/groups with tag numbers of >2,000 are shown in the Circos plot. (D) Genus-level stack diagram showing relative abundances of gut microbiota genera in the HC, PTB, and TBM groups. HC, healthy control; PTB, patients with pulmonary tuberculosis; TBM, patients with tuberculous meningitis.

