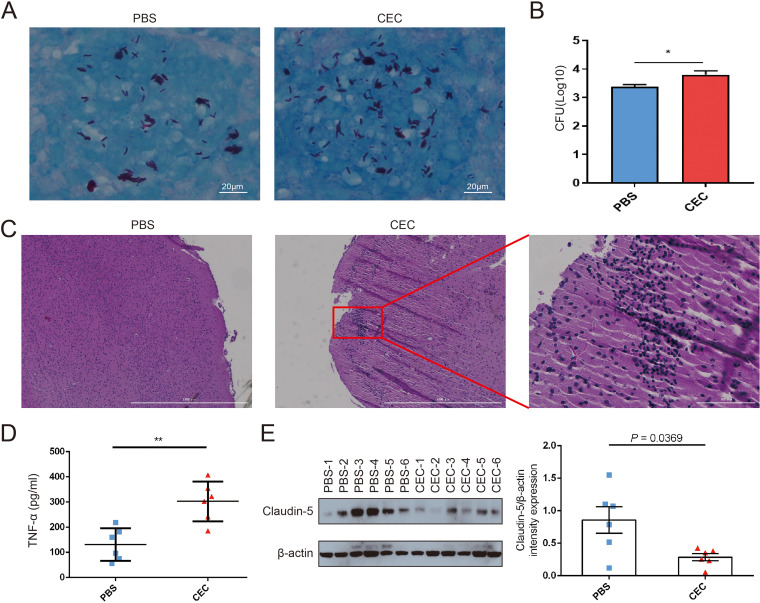
FIG 6.
Gut microbiome dysbiosis was associated with increased M. tuberculosis burden in mouse brain tissues. (A) Acid-fast bacilli were visualized by ZN staining in paraffin wax sections of brain tissue from C57BL/6 mice administered PBS or CEC by gavage. (B) Brain bacterial counts 2 weeks after M. tuberculous injection of mice previously treated by gavage with CEC or PBS. (C) Inflammation of mouse brain tissues as determined from stained brain tissue sections via microscopy. (D) TNF-α levels in serum from C57BL/6 mice 2 weeks after M. tuberculous injection. (E) Left, Western blotting results showing claudin-5 levels in brain tissues of C57BL/6 mice; right, quantitative analysis of claudin-5 expression in brain tissues of C57BL/6 mice. Data were normalized based on β-actin expression as the loading control and are expressed as fold changes. Each value is expressed as the mean ± SEM as determined using Student’s t test for the analysis, with a P of <0.05 (*) considered significant. CEC, clinical E. coli isolate.

