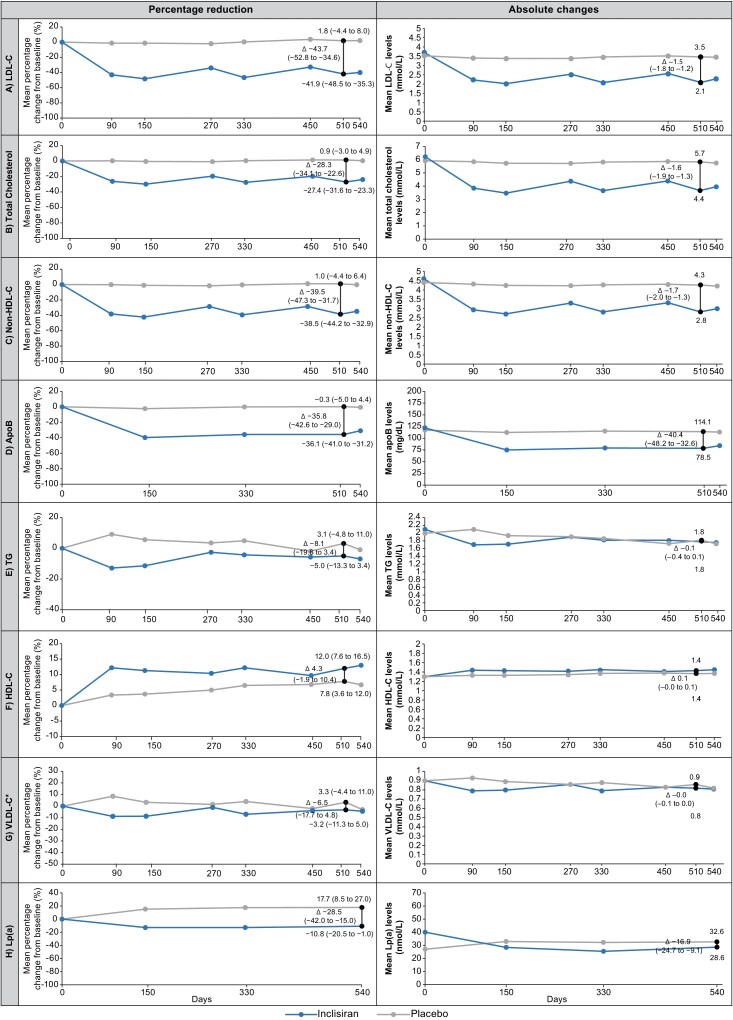
Figure 1.
Mean percentage and absolute changes from baseline over time in (A) low-density lipoprotein cholesterol, (B) total cholesterol, (C) non-high-density lipoprotein cholesterol, (D) apolipoproteinB, (E) triglycerides, (F) high-density lipoprotein cholesterol, (G) very low-density lipoprotein cholesterol, and (H) lipoprotein(a) (intention-to-treat population). * VLDL-C calculated. Mean percentage change from baseline and absolute change for all lipoproteins were measured at baseline and on Days 90, 150, 270, 330, 450, 510, and 540; except for apoB, which was measured on Days 150, 330, 510, and 540. VLDL-C was measured on Day 510 but otherwise calculated. Lp(a) was measured on Days 150, 330, and 540. Graphs show data analysed by mixed models for repeated measures, except for the mean percentage and absolute changes in LDL-C from baseline at Day 510, which were analysed by analysis of covariance and control-based pattern-mixture model, respectively. The black vertical line represents least squares mean (95% CI) percentage or absolute change from baseline to Day 510 for all lipoproteins and Day 540 for lp(a). The P-values for placebo-corrected mean percentage change from baseline to Day 510 were P < 0.0001 for all except triglycerides (P = 0.169), HDL-C (P = 0.170) and VLDL-C (P = 0.257). The P-values for the placebo-corrected absolute change from baseline to Day 510 were P < 0.0001 for all except triglycerides (P = 0.381), HDL-C (P = 0.112) and VLDL-C (P = 0.343). Inclisiran, n = 98; placebo, n = 105. ApoB, apolipoprotein B; CI, confidence interval; HDL-C, high-density lipoprotein cholesterol; LDL-C, low-density lipoprotein cholesterol; Lp(a), lipoprotein (a); TG, triglycerides; VLDL-C, very low-density lipoprotein cholesterol.

