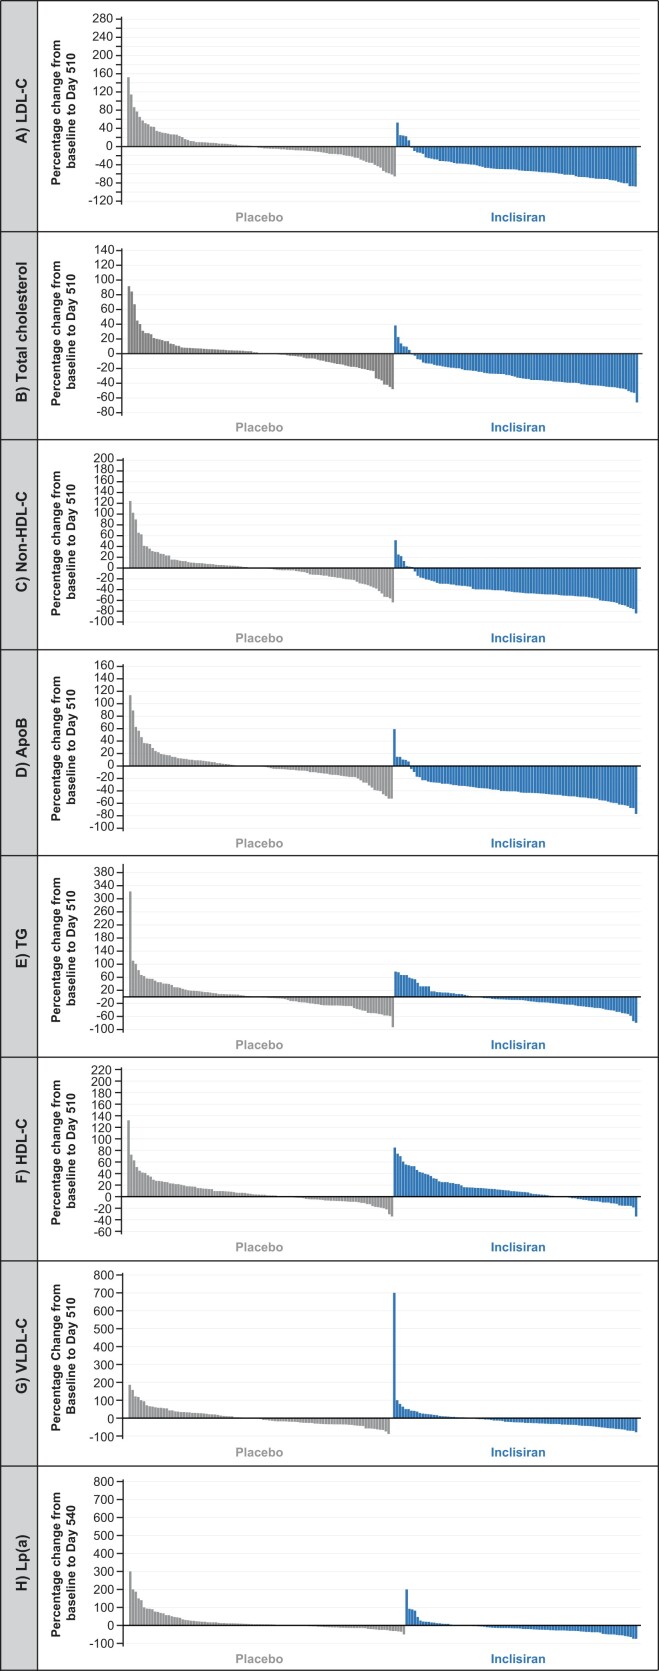
Figure 3.
Inter-individual variation from baseline to Day 510 in (A) low-density lipoprotein cholesterol, (B) total cholesterol, (C) non-high-density lipoprotein cholesterol, (D) apolipoproteinB, (E) triglycerides, (F) high-density lipoprotein cholesterol, (G) very low-density lipoprotein cholesterol, and (H) lipoprotein(a) (intention-to-treat population). The waterfall plots shown represent the changes in LDL-C, total cholesterol, non-HDL-C, apoB, triglycerides, HDL-C, and VLDL-C between two specified time points in individuals with observed data both at baseline and Day 510 and for lp(a) at baseline and Day 540. Data are presented in the following order: patients with the greatest increase to patients with the greatest decrease for each parameter. Inclisiran, n = 98; placebo, n = 105. ApoB, apolipoproteinB; HDL-C, high-density lipoprotein cholesterol; LDL-C, low-density lipoprotein cholesterol; Lp(a), lipoprotein(a); TG, triglycerides; VLDL-C, very low-density lipoprotein cholesterol.

