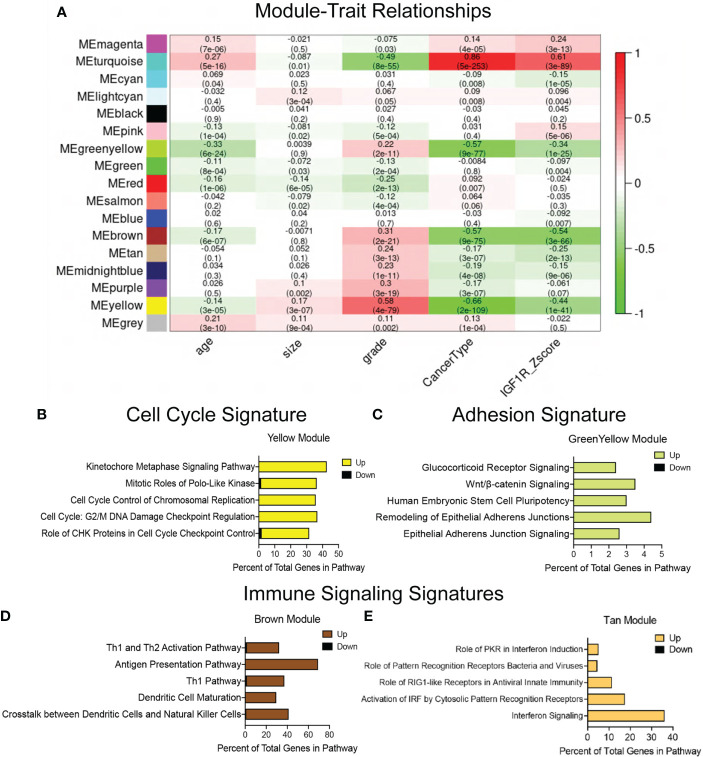
Figure 1.
Defining gene signatures associated with IGF1R expression and tumor phenotype in human breast cancers. (A) Table of refined integrated WGCNA (IGF1R-GS2) showing module and clinical trait association. Each row corresponds to a module eigengene (ME), each column to a clinical measurement. Each cell contains the corresponding correlation and p-value (in parentheses). The table is color-coded by correlation according to the color legend. Green < 0 for negative correlation; Red > 0, for positive correlation. (B–E) Top 5 pathways identified by ingenuity pathway analysis (IPA) revealing key signatures in 4 modules inversely correlated with IGF1R expression. (yellow module=cell cycle signature, greenyellow module=adhesion signature, brown and tan modules=immune signaling signatures).

