Figure 5.
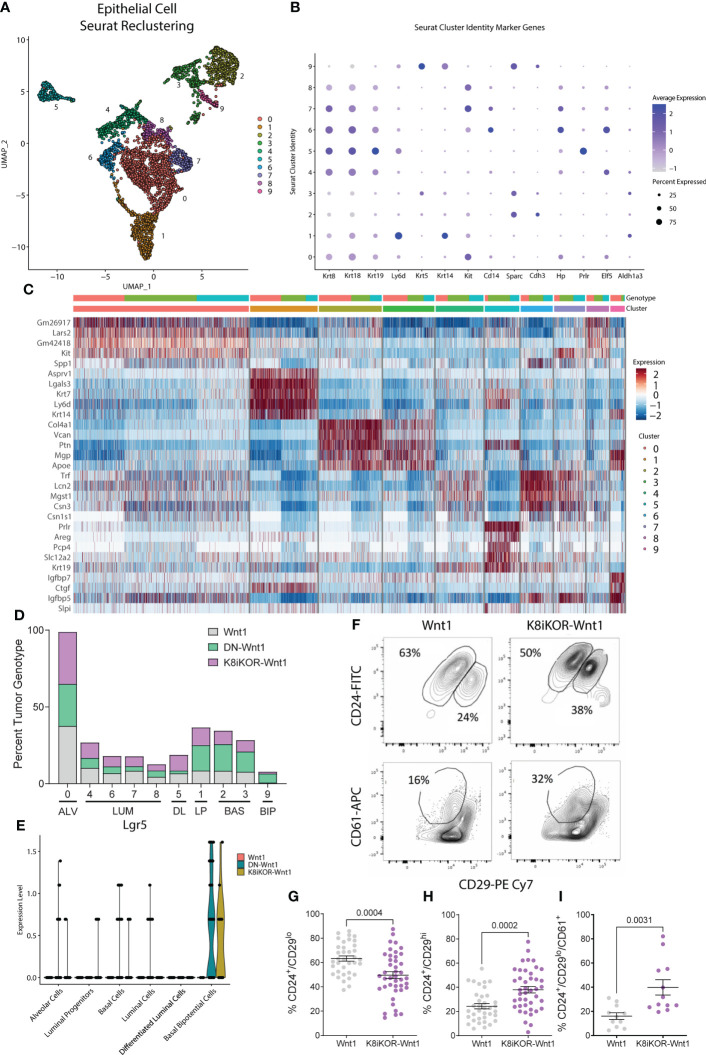
Epithelial cell populations are altered with reduced IGF1R. (A) UMAP plot of re-clustering of epithelial cells from Wnt1, DN-Wnt1, and K8iKOR-Wnt1 tumors resulting in 13 clusters. (B) Dot plot of epithelial cell markers. (C) Heat map of top epithelial cell type markers. Top legend: top row=tumor identity: red=Wnt1, green=DN-Wnt1, blue=K8iKOR-Wnt1; Bottom row=epithelial cell cluster. (D) Percent tumor genotype graph for each cell cluster labelled with each cell type defined by markers. (ALV=alveolar cell, LUM=luminal cell, DL=differentiated luminal cell, LP=luminal progenitor, BAS=basal cell, BIP=basal bipotential progenitor). (E) Violin plot for Lgr5 in each annotated cluster and tumor type. (F) Representative contour plots of flow cytometry of the CD24+/CD29lo (luminal) and CD24+/CD29hi (basal) cell populations and CD24+/CD29lo/CD61- (luminal progenitor) cell population in Wnt1 and K8iKOR-Wnt1 tumors. G-I. Quantification of luminal (G), basal (H), and luminal progenitor (I) populations in Wnt1 and K8iKOR-Wnt1 tumors. Each dot represents an individual tumor. Statistic: Unpaired Student’s t-test.

