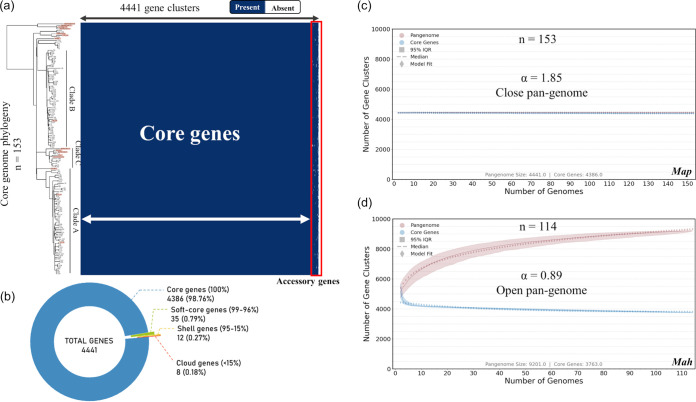
FIG 2.
Pangenome analysis of M. avium subsp. paratuberculosis (Map). (a) Pangenome gene cluster presence/absence matrix of 153 M. avium subsp. paratuberculosis genomes where blue blocks indicate presence of the gene in that cluster and white indicates its absence. The corresponding maximum likelihood phylogenetic tree, inferred on concatenation of 3,335 core genes (see Materials and Methods) from 153 M. avium subsp. paratuberculosis genomes, is presented on the left, and isolates listed on the tree correspond to each row of the matrix. Complete genomes are highlighted in orange on the tree. Accessory genes are shown in the red box at the right. (b) Pie chart representing proportion of core genes (present in ≤99% of genomes), shell genes (present in between 15% and 99% of genomes), and cloud genes (present in ≤15% of genomes). The majority of gene clusters belonging to the shell and cloud genomes were annotated as hypothetical proteins. The right half of the figure shows two gene cluster accumulation curves for the pangenome (red) and core genome (blue), with 1,000 isolate permutations for 153 M. avium subsp. paratuberculosis genomes (c) and 114 M. avium subsp. hominissuis (Mah) genomes (d). The Heap’s law α value was determined using the median values of 1,000 strain permutations. Openness of the pangenome is also indicated.

