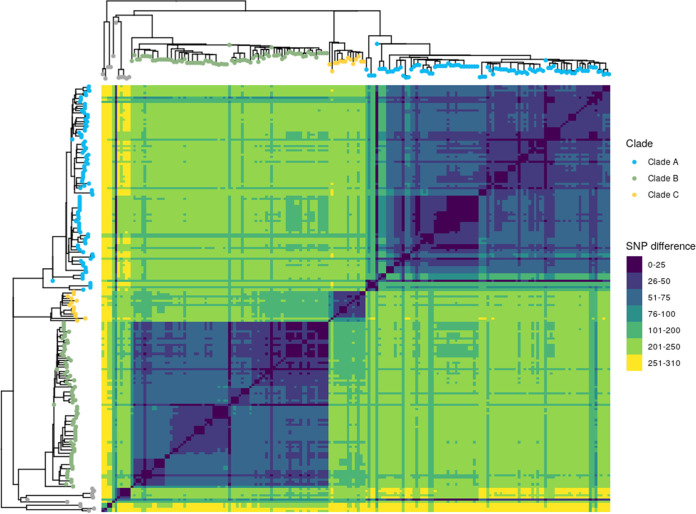
FIG 4.
Closely related M. avium subsp. paratuberculosis isolates separated into clades. Shown is a heat map illustrating pairwise SNP distances between genomes belonging to each clade. Both axes have a maximum likelihood SNP-based tree inferred on 193 genomes with the leaf colored according to clade. Trees were midpoint rooted. The SNP difference key is shown to the right.

