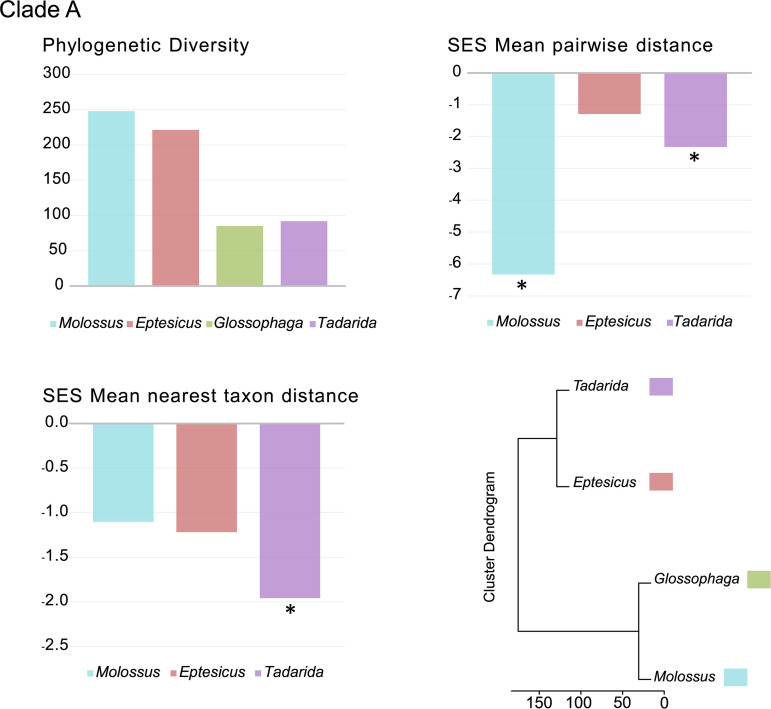
FIG 4.
Phylogenetic diversity analyses. Metrics of CoV phylogenetic diversity within each bat genus are shown for clade A. (Top left) Phylogenetic diversity; (top right) standardized effect size (SES) of the mean phylogenetic distance; (bottom left) standardized effect size of the mean nearest-taxon distance; (bottom right) phylogenetic ordination among bat host genera for alphaCoVs. One-tailed P values (quantiles) were calculated after randomly reshuffling tip labels 1,000 times along the entire phylogeny. Values departing significantly from the null model (P value of <0.05) are indicated with an asterisk. All exact P values are available in Table S3 in the supplemental material.

