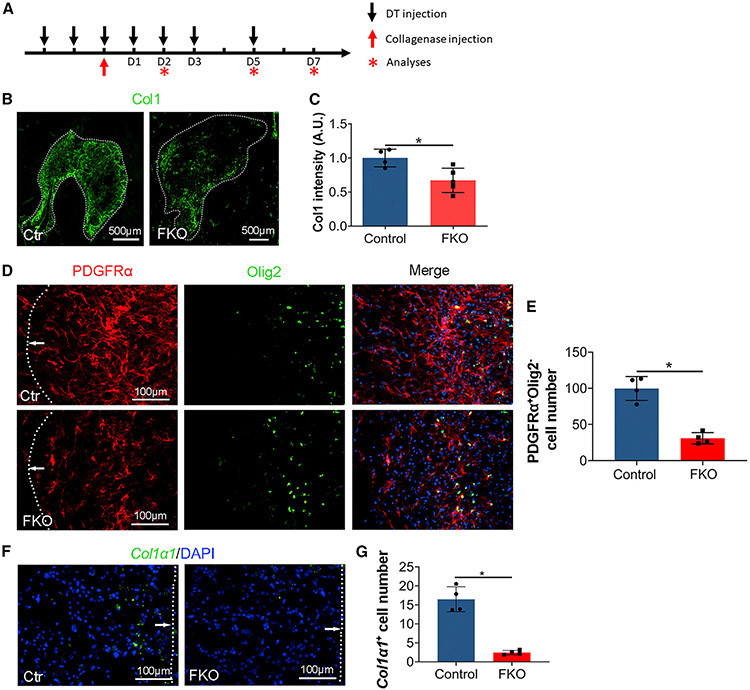
Figure 2. Col1α1+ fibroblasts are ablated in FKO mice after ICH.
(A) Schematic illustration of time points for DT and collagenase injections.
(B) Representative images of Col1 (green) in control and FKO mice at day 7 after ICH. Dotted lines indicate hematoma. Scale bars, 500 μm.
(C) Quantification of Col1 intensity in the peri-hematoma region in control and FKO mice. n = 4–5 mice. *p = 0.0317 by Mann-Whitney U test.
(D) Representative images of PDGFRα (red), Olig2 (green), and DAPI (blue) in control and FKO mice at day 7 after ICH. Dotted lines and arrows indicate hematoma. Scale bars, 100 μm.
(E) Quantification of PDGFRα+Olig2− cells in the peri-hematoma region in control and FKO mice. n = 4 mice. *p = 0.0286 by Mann-Whitney U test.
(F) Representative images of Col1α1 mRNA (green, detected by RNAscope in situ hybridization) and DAPI (blue) in control and FKO mice at day 7 after ICH. Dotted lines and arrows indicate hematoma. Scale bars, 100 μm.
(G) Quantification of Col1α1 mRNA-expressing cells in the peri-hematoma region in control and FKO mice. n = 4 mice. *p = 0.0286 by Mann-Whitney U test.
Data were shown as mean ± SD. See also Figure S4.

