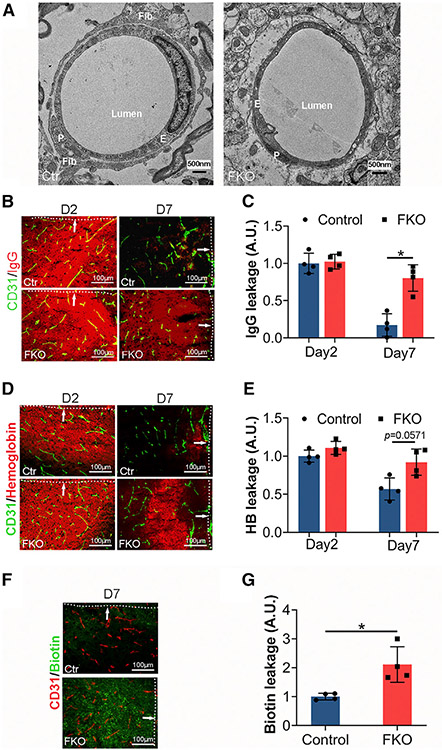
Figure 4. Ablation of Col1α1+ fibroblasts exacerbates BBB damage.
(A) Representative transmission electron microscopy images showing association of fibroblasts with capillaries in control brains and lack of fibroblasts around capillaries in FKO brains at day 7 after ICH. Fibroblasts (Fib), endothelial cells (E), and pericytes (P) are indicated in the images. Scale bars, 500 nm.
(B) Representative images of IgG (red) and CD31 (green) in the peri-hematoma region in control and FKO brains at days 2 and 7 after ICH. Dotted lines and arrows indicate hematoma. Scale bars, 100 μm.
(C) Quantification of IgG intensity in the peri-hematoma region in control and FKO brains at days 2 and 7 after ICH. n = 4 mice. *p = 0.0286 by Mann-Whitney U test.
(D) Representative images of hemoglobin (red) and CD31 (green) in the peri-hematoma region in control and FKO brains at days 2 and 7 after ICH. Dotted lines and arrows indicate hematoma. Scale bars, 100 μm.
(E) Quantification of hemoglobin intensity in the peri-hematoma region in control and FKO brains at days 2 and 7 after ICH. n = 4 mice. p = 0.0571 by Mann-Whitney U test.
(F) Representative images of biotin (green) and CD31 (red) in the peri-hematoma region in control and FKO brains at day 7 after ICH. Dotted lines and arrows indicate hematoma. Scale bars, 100 μm.
(G) Quantification of biotin intensity in the peri-hematoma region in control and FKO brains at day 7 after ICH. n = 4 mice. *p = 0.0286 by Mann-Whitney U test.
Data were shown as mean ± SD. See also Figures S5 and S6.

