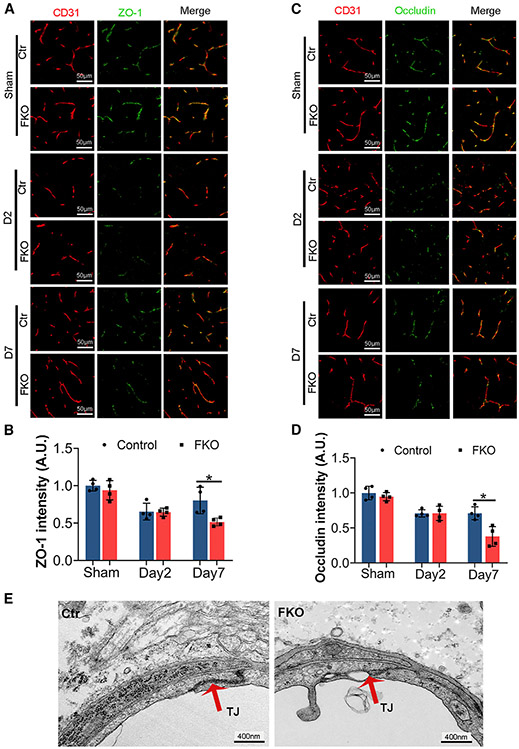
Figure 5. Ablation of Col1α1+ fibroblasts increases tight junction disruption.
(A) Representative images of ZO-1 (green) and CD31 (red) in the peri-hematoma region in control and FKO brains in the sham group and at days 2 and 7 after ICH. Scale bars, 50 μm.
(B) Quantification of ZO-1 intensity in the peri-hematoma region in control and FKO brains. n = 4 mice, *p = 0.0286 by Mann-Whitney U test.
(C) Representative images of occludin (green) and CD31 (red) in the peri-hematoma region in control and FKO brains in the sham group and at days 2 and 7 after ICH. Scale bars, 50 μm.
(D) Quantification of occludin intensity in the peri-hematoma region in control and FKO brains. n = 4 mice, *p = 0.0286 by Mann-Whitney U test.
(E) Representative transmission electron microscopy images showing the ultrastructure of endothelial tight junctions in control and FKO brains at day 7 after ICH. Red arrows indicate tight junctions. Scale bars, 400 nm.
Data were shown as mean ± SD.

