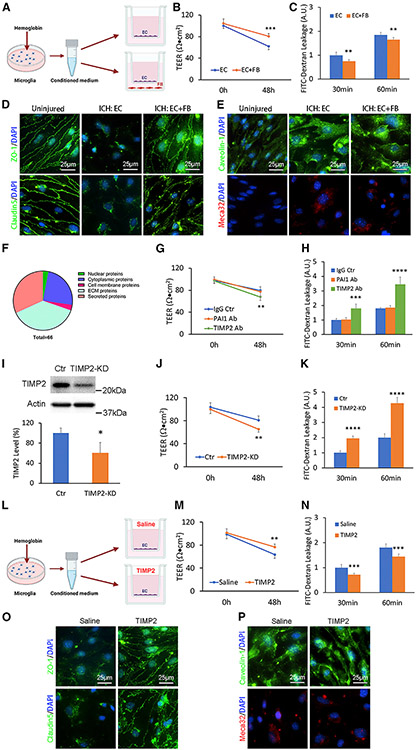
Figure 6. Fibroblast-derived TIMP2 promotes BBB integrity in an in vitro ICH model.
(A) Schematic illustration of the in vitro ICH model.
(B) TEER values of the in vitro ICH model in the presence or absence of fibroblasts. n = 6 biological replicates. ***p = 0.0002 by Student’s t test.
(C) Quantification of 4-kDa FITC-dextran leakage in the in vitro ICH model in the presence or absence of fibroblasts. n = 6 biological replicates. **p = 0.0016 and **p = 0.0060 for 30- and 60-min time points by Student’s t test, respectively.
(D) Representative images of ZO-1 (green), claudin5 (green), and DAPI (blue) in primary human brain microvascular endothelial cells (HBMECs) under normal conditions (uninjured) and at 48 h after in vitro ICH with or without fibroblasts. Scale bars, 25 μm.
(E) Representative images of caveolin-1 (green), meca32 (red), and DAPI (blue) in primary HBMECs under normal conditions (uninjured) and at 48 h after in vitro ICH with or without fibroblasts. Scale bars, 25 μm.
(F) Pie chart showing the percentage of each category of proteins relative to total fibroblast-derived proteins identified by LC-MS/MS.
(G) TEER values of the in vitro ICH model in the presence of mouse IgG (control), PAI1 function-blocking antibody, and TIMP2 function-blocking antibody. n = 6 biological replicates. **p = 0.0088 by Student’s t test.
(H) Quantification of 4-kDa FITC-dextran leakage in the in vitro ICH model in the presence of mouse IgG (control), PAI1 function-blocking antibody, and TIMP2 function-blocking antibody. n = 6 biological replicates, ***p = 0.00013 and ****p < 0.0001 at 30- and 60-min time points by Student’s t test, respectively.
(I) Representative western blot image and quantification of TIMP2 expression secreted by fibroblasts after transduction of lentivirus-expressing TIMP2 short hairpin RNA (shRNA) or a scramble sequence (control). n = 5 biological replicates. *p = 0.0121 by Mann-Whitney U test.
(J) TEER values of the in vitro ICH model in the presence of control or TIMP2-knockdown fibroblasts. n = 6 biological replicates. **p = 0.0017 by Student’s t test.
(K) Quantification of 4-kDa FITC-dextran leakage in the in vitro ICH model in the presence of control or TIMP2-knockdown fibroblasts. n = 6 biological replicates. ****p < 0.0001 by Student’s t test.
(L) Schematic illustration of in vitro TIMP2 rescue experiments.
(M) TEER values of the in vitro ICH model in the presence of saline (control) or recombinant TIMP2 protein. n = 6 biological replicates. **p = 0.0028 by Student’s t test.
(N) Quantification of 4-kDa FITC-dextran leakage in the in vitro ICH model in the presence of saline (control) or recombinant TIMP2 protein. n = 6 biological replicates. ***p = 0.0006 and ***p = 0.0007 at 30- and 60-min time points by Student’s t test, respectively.
(O) Representative images of ZO-1 (green), claudin5 (green), and DAPI (blue) in primary HBMECs treated with saline (control) or recombinant TIMP2 protein at 48 h after in vitro ICH. Scale bars, 25 μm.
(P) Representative images of caveolin-1 (green), meca32 (red), and DAPI (blue) in primary HBMECs treated with saline (control) or recombinant TIMP2 protein at 48 h after in vitro ICH. Scale bars, 25 μm.
Data were shown as mean ± SD. EC, endothelial cell; FB, fibroblast; KD, knockdown. See also Figure S7 and Table S1.

