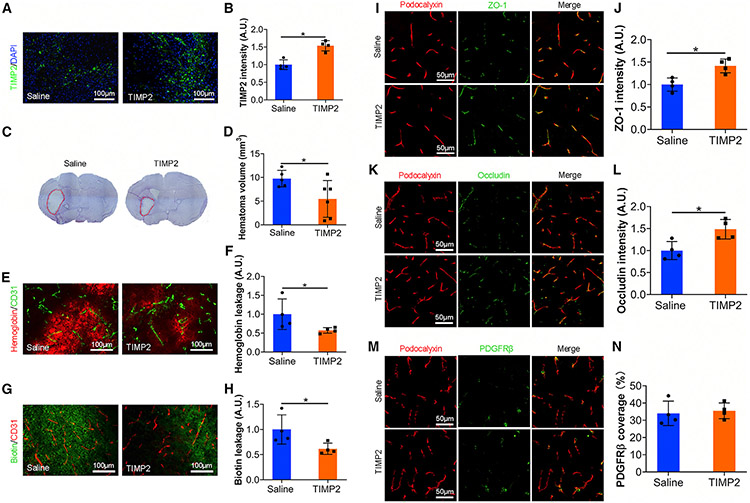
Figure 7. TIMP2 treatment enhances BBB integrity in FKO mice in vivo.
(A) Representative images of TIMP2 (green) and DAPI (blue) in the peri-hematoma regions of saline- and TIMP2-treated FKO mice at day 7 after ICH. Scale bars, 100 μm.
(B) Quantification of TIMP2 intensity in the peri-hematoma regions of saline- and TIMP2-treated mice at day 7 after ICH. n = 4 mice. *p = 0.0286 by Mann-Whitney U test.
(C) Representative images of cresyl violet staining in saline- and TIMP2-treated FKO mice at day 7 after ICH. Dotted lines indicate injury areas.
(D) Quantification of injury volume in saline- and TIMP2-treated mice at day 7 after ICH. n = 5–6 mice. *p = 0.0491 by Student’s t test.
(E) Representative images of hemoglobin (red) and CD31 (green) in the peri-hematoma regions of saline- and TIMP2-treated mice at day 7 after ICH. Scale bars, 100 μm.
(F) Quantification of hemoglobin intensity in the peri-hematoma regions of saline- and TIMP2-treated mice at day 7 after ICH. n = 4 mice. *p = 0.0286 by Mann-Whitney U test.
(G) Representative images of biotin (green) and CD31 (red) in the peri-hematoma regions of saline- and FKO-treated mice at day 7 after ICH. Scale bars, 100 μm.
(H) Quantification of biotin intensity in the peri-hematoma regions of saline- and TIMP2-treated mice. n = 4 mice. *p = 0.0286 by Mann-Whitney U test.
(I) Representative images of ZO-1 (green) and podocalyxin (red) in the peri-hematoma regions of saline- and TIMP2-treated mice at day 7 after ICH. Scale bars, 50 μm.
(J) Quantification of ZO-1 intensity normalized to podocalyxin-positive area in saline- and TIMP2-treated mice. n = 4 mice. *p = 0.0286 by Mann-Whitney U test.
(K) Representative images of occludin (green) and podocalyxin (red) in the peri-hematoma regions of saline- and TIMP2-treated mice at day 7 after ICH. Scale bars, 50 μm.
(L) Quantification of occludin intensity normalized to podocalyxin-positive area in saline- and TIMP2-treated mice. n = 4 mice. *p = 0.0286 by Mann-Whitney U test.
(M) Representative images of PDGFRβ (green) and podocalyxin (red) in the peri-hematoma regions of saline- and TIMP2-treated mice at day 7 after ICH. Scale bars, 50 μm.
(N) Quantification of PDGFRβ coverage over podocalyxin-positive capillaries in saline- and TIMP2-treated mice. n = 4 mice. Data were shown as mean ± SD.

