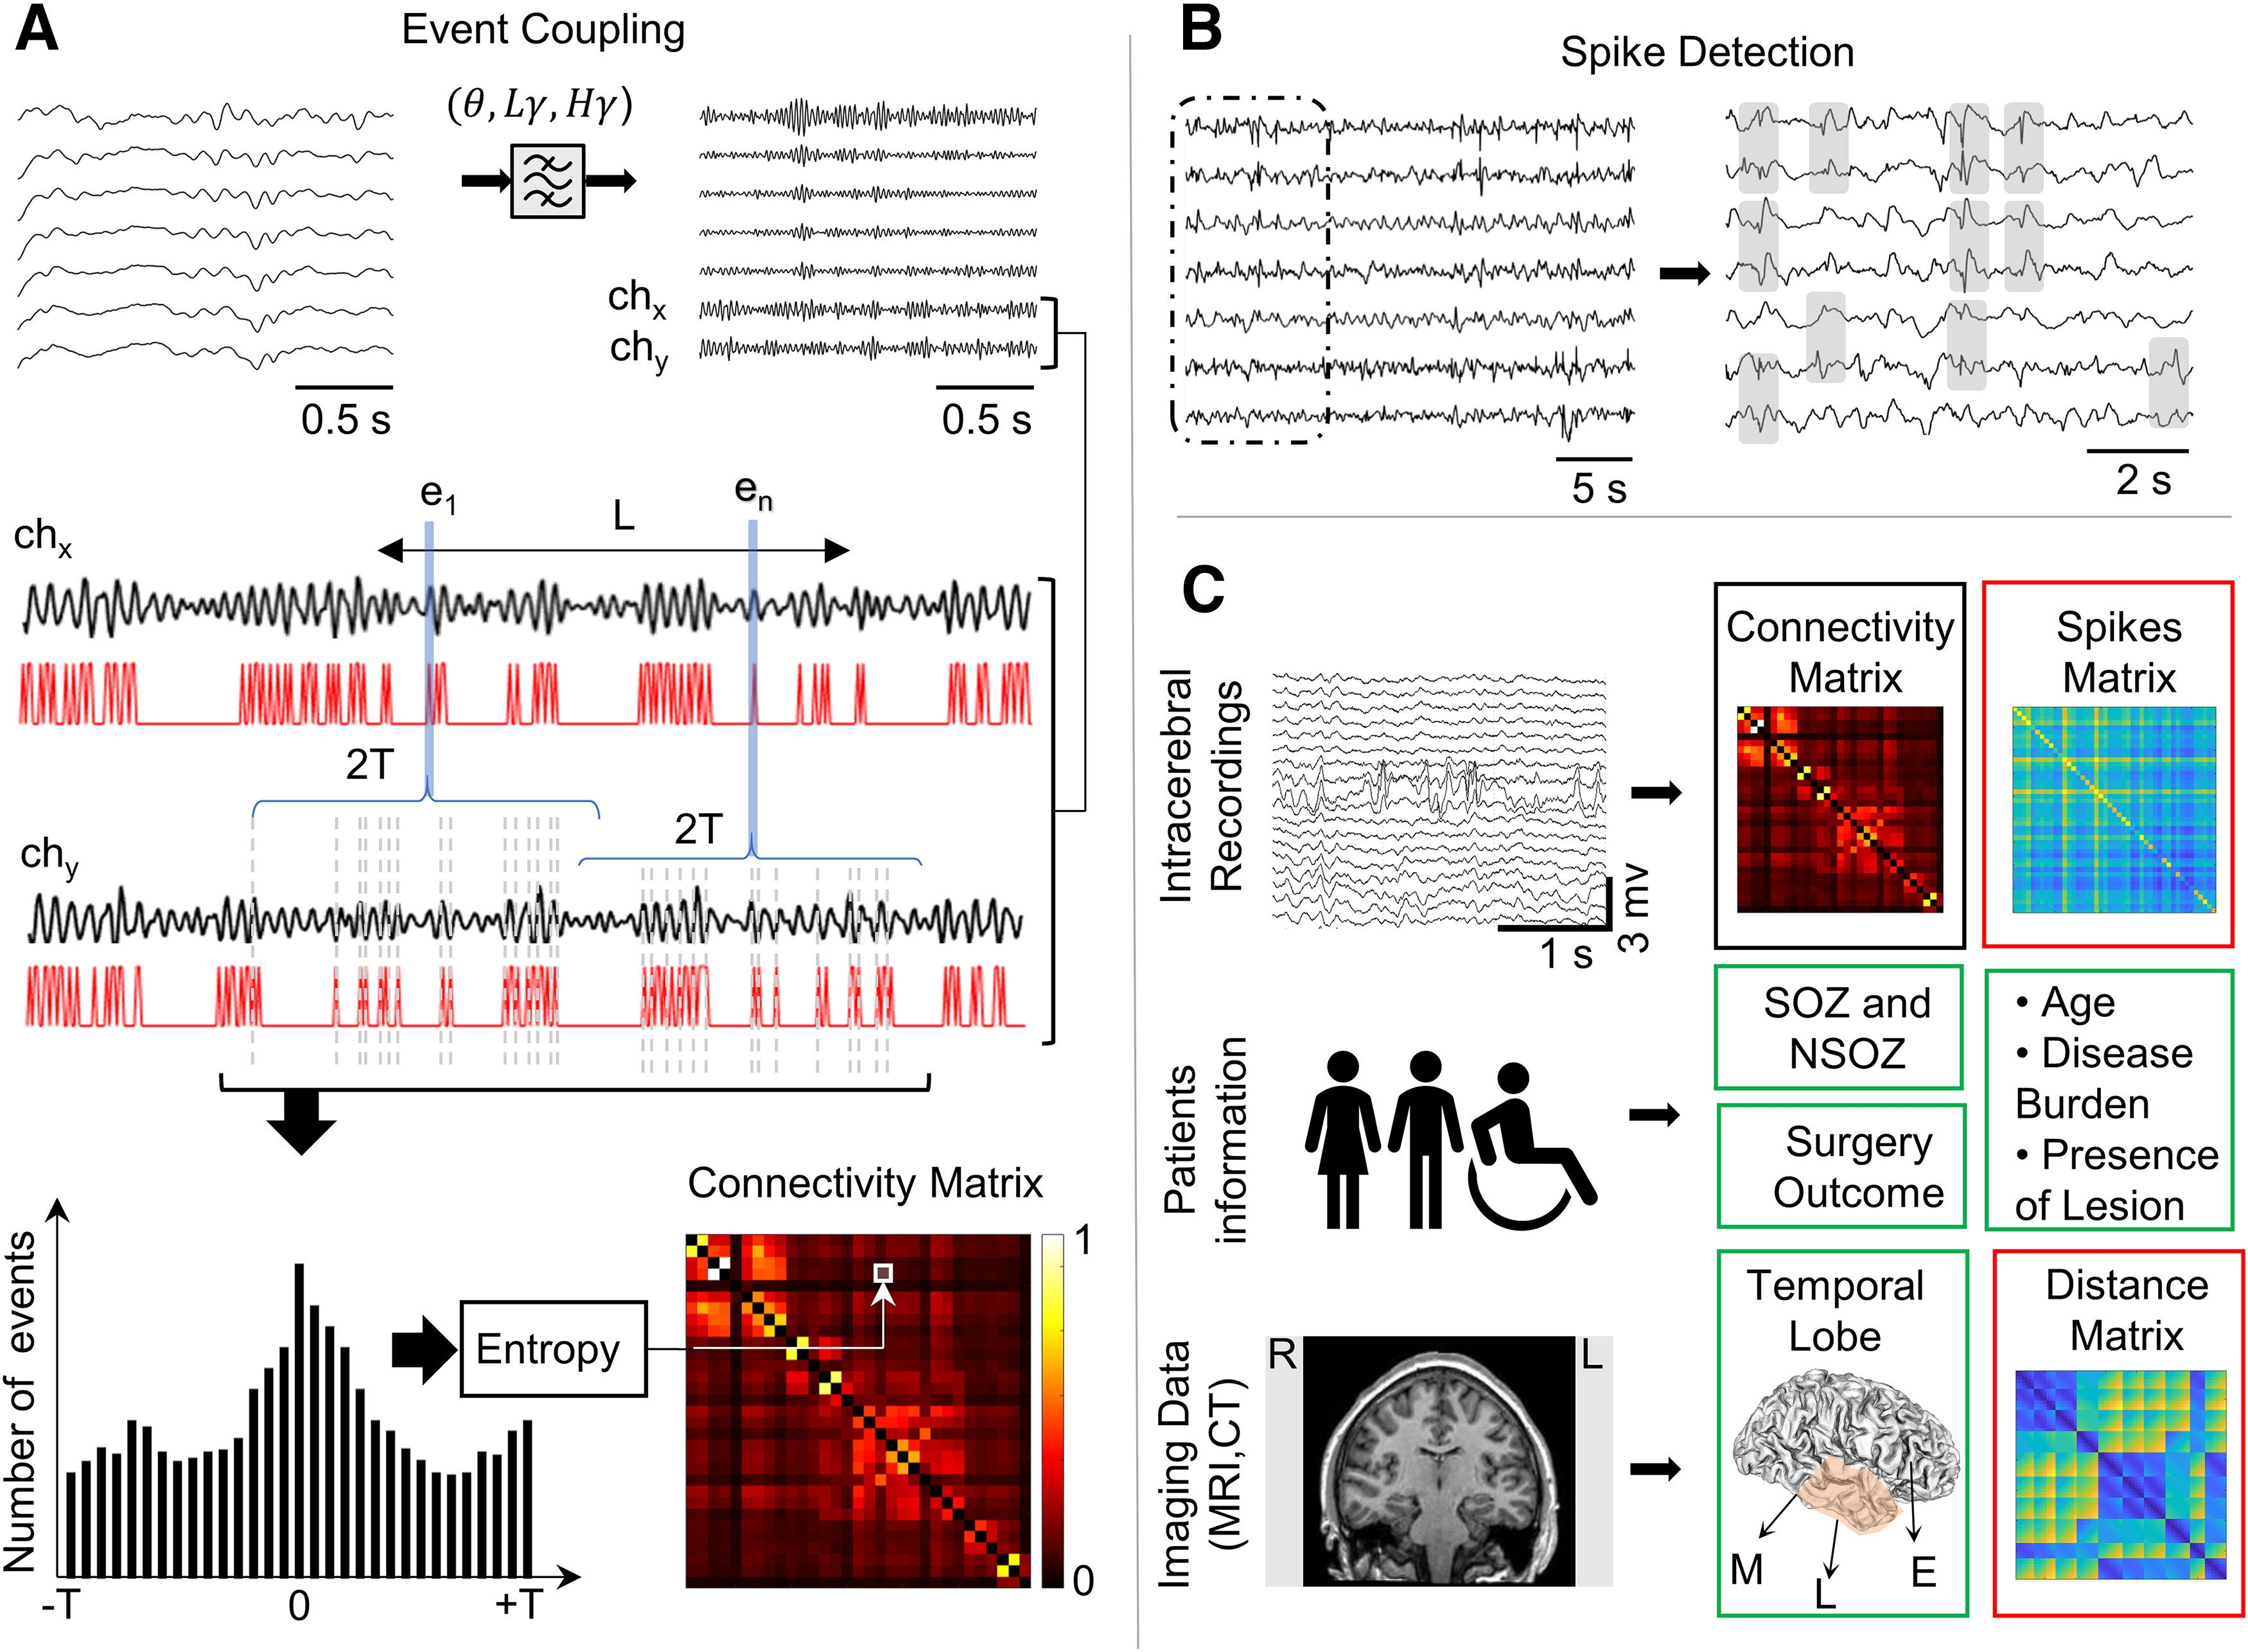
Figure 1.

EEG analysis pipeline. A, Unfiltered intracerebral EEG signals are bandpass filtered to extract spectral frequencies in theta ( ), low gamma ), or high gamma bands ( . Functional coupling between a pair of channels (chx, chy) is illustrated in second row. A frequency-dependent time interval L (30 s for , 60 s for , and 5 min for ) is chosen, and from the signals on chx and chy, the local event’s amplitude maxima ei (i = 1 … n) in L are detected (represented in red traces). For each ei in chx, the lead or lag in relation to events in chy within time interval [–T, T] is quantified in a peri-event histogram (bottom left). The distribution of the histogram is evaluated using Shannon entropy, and a low entropy value is an indication of a peak in the histogram, which represents the strength of functional coupling for every pair of channels in the connectivity matrix (bottom right). Patients with 2-kHz sampling rate (N = 15) and those with 200-Hz sampling rate (N = 28) were both used in this study, refer to Extended Data Figure 1-1 for detailed justification. B, Spikes are detected from unfiltered interictal data using an automatic detector based on signal whitening. The gray boxes show the detected spikes on different channels. For every pair of contact coupling strength is computed as a rate of the sum of spikes on each channel divided by the recording duration in minutes. C, Statistical model includes EEG recordings to generate functional connectivity matrix (black box) and the spikes matrix (red box), patients information and test results to assess seizure onset zone (SOZ), surgery outcome, and other measures (e.g., seizure frequency), and CT scans co-registered to MRI scans to localize electrode contacts, group contacts with respect to brain region (green box), and calculate the distance between each pair of contacts to generate distance matrices (red box). Ipsilateral and contralateral grouping was ignored (see Extended Data Fig. 1-2).
