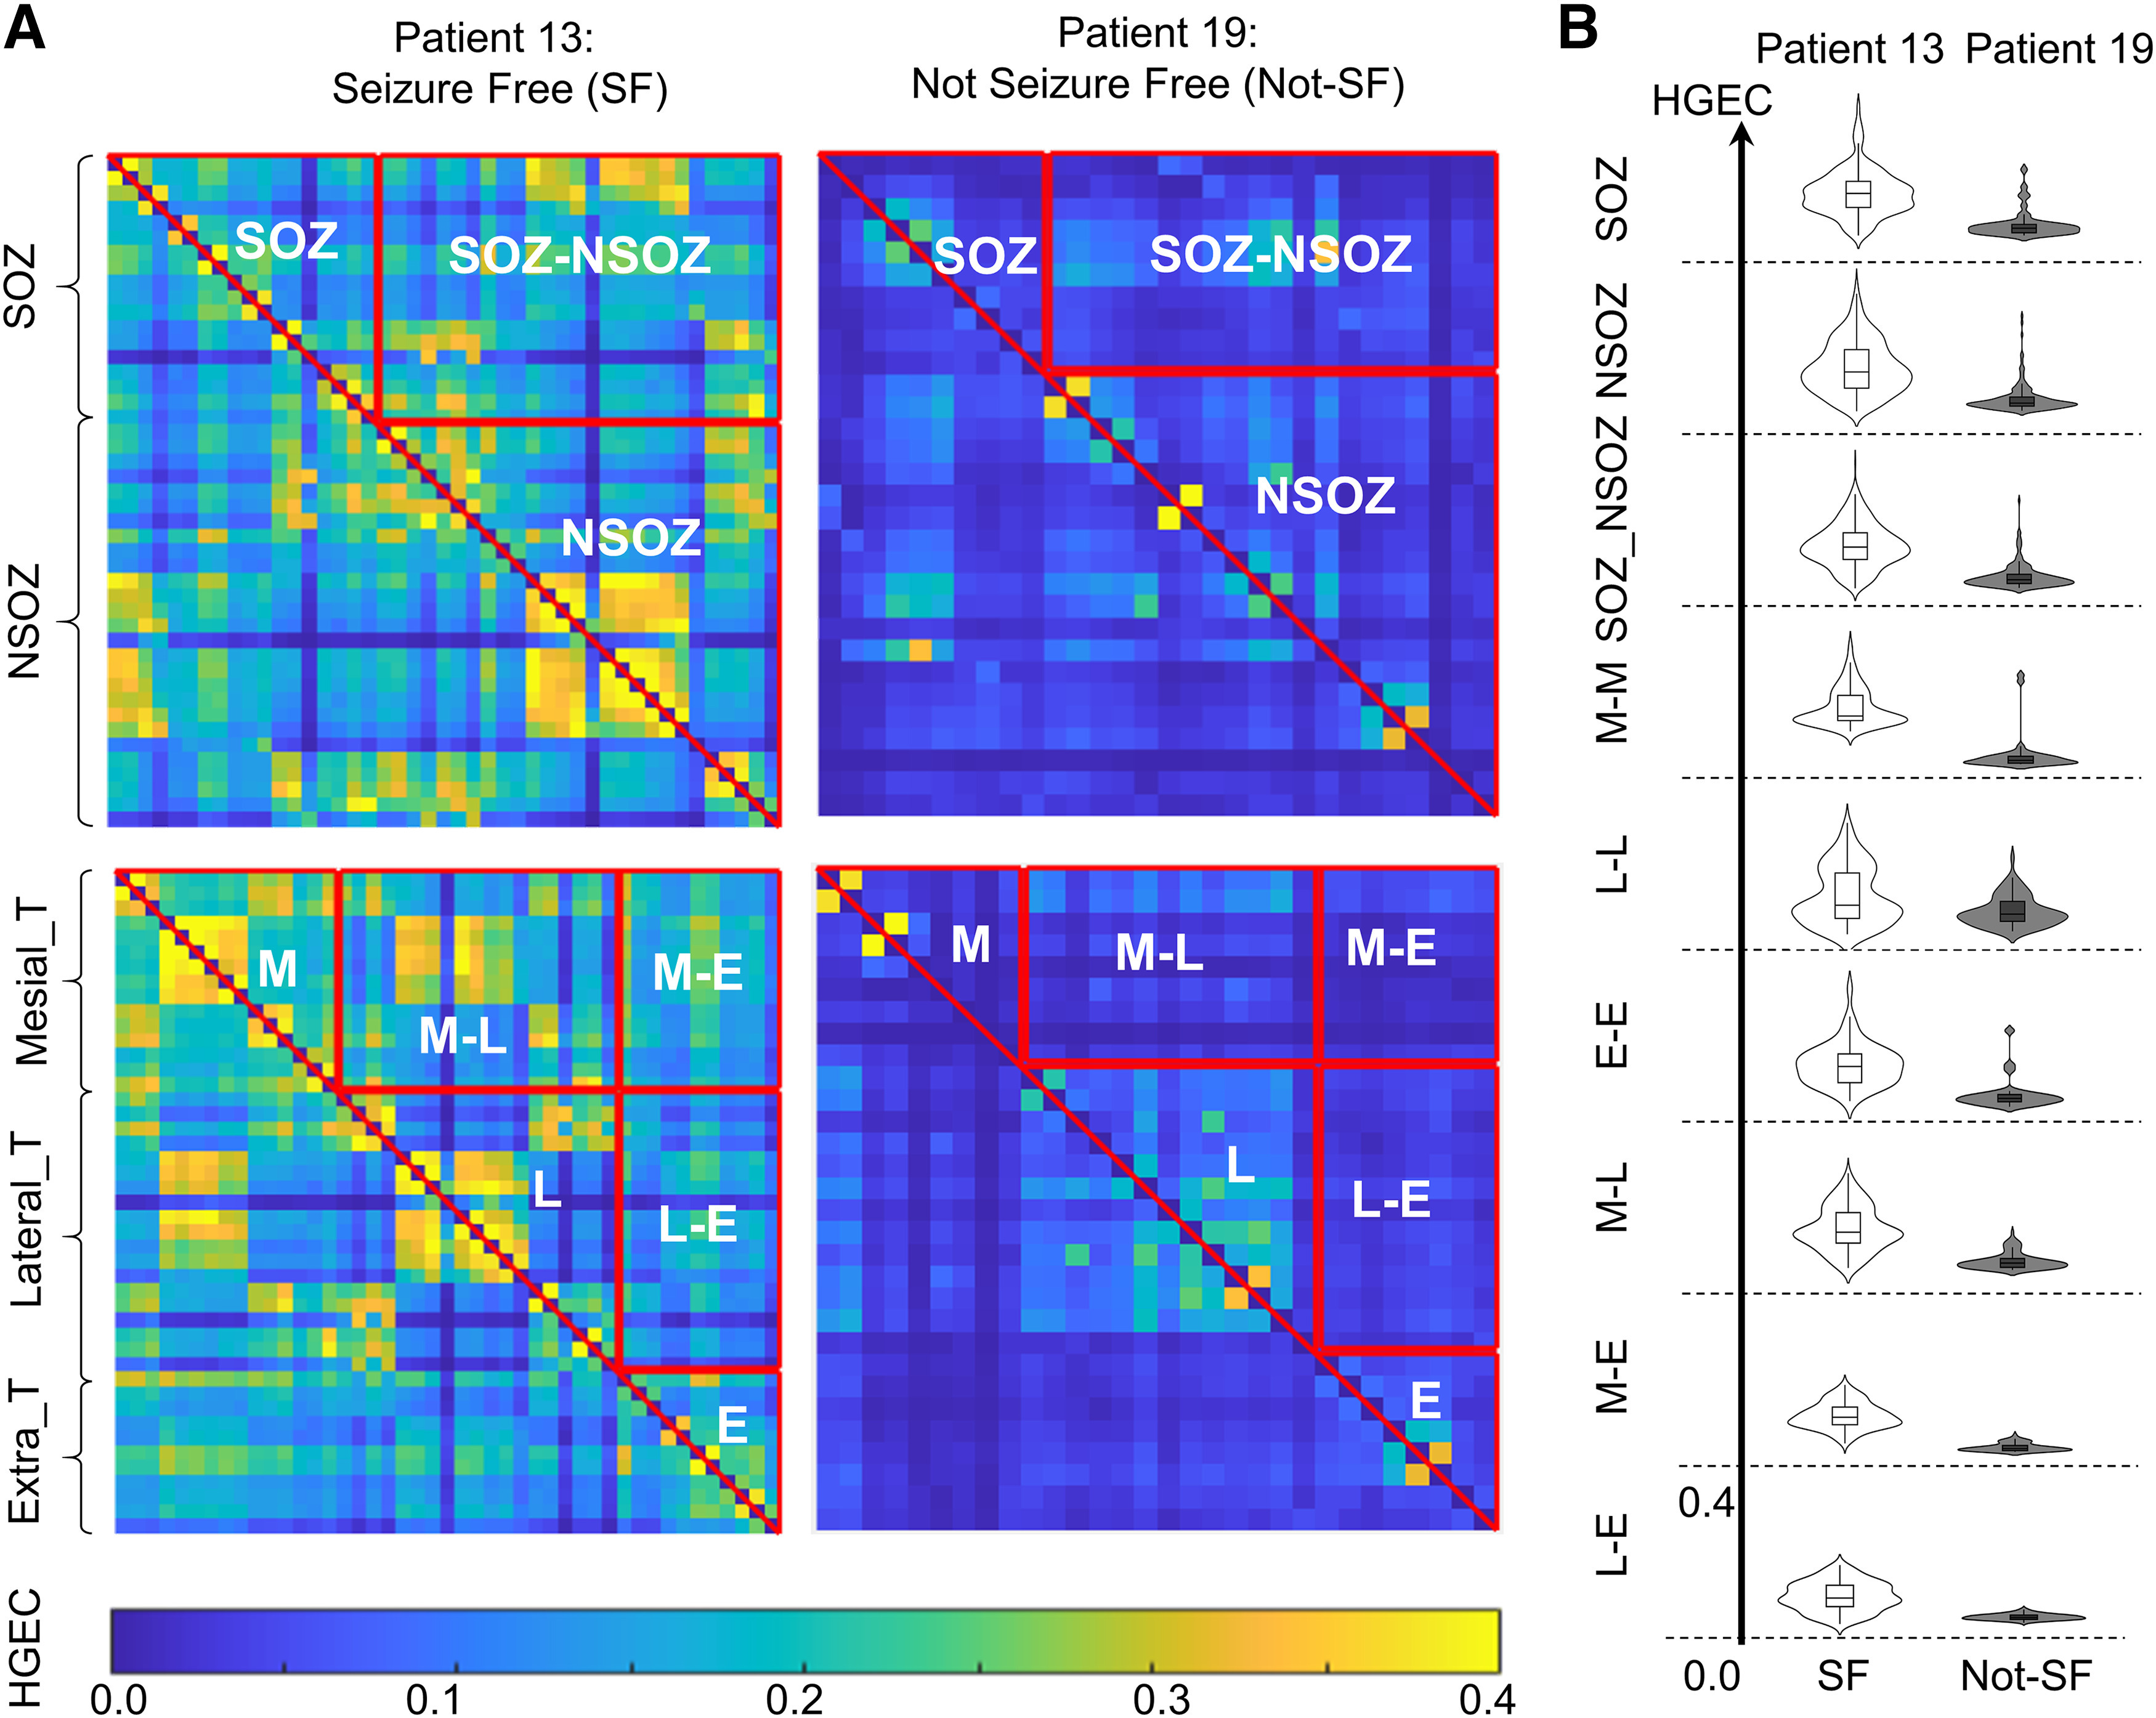
Figure 2.

High gamma event coupling in the SOZ and different brain regions. A, Examples of connectivity matrices of high gamma event coupling (HGEC) for patient 13 who was seizure-free (SF) and patient 19 who was not seizure-free (not-SF). The matrices are organized with respect to SOZ. If both electrode contacts are in SOZ, then the connectivity value is part of the SOZ, if both contacts are outside SOZ, then it is part of the NSOZ (complement), otherwise it is between the SOZ and NSOZ. The lower row illustrates HGEC organized by brain region (M: mesial temporal, L: lateral temporal, E: extratemporal). B, Violin plot and box plot (inside) shows the distribution, median and interquartile range of HGEC values for patients 13 and 19 with respect to SOZ (top rows) f and brain regions (bottom rows). In most cases, HGEC is stronger in patient 13 than patient 19. Check Extended Data Figure 2-1 for GEC matrices of all patients.
