Figure 6.
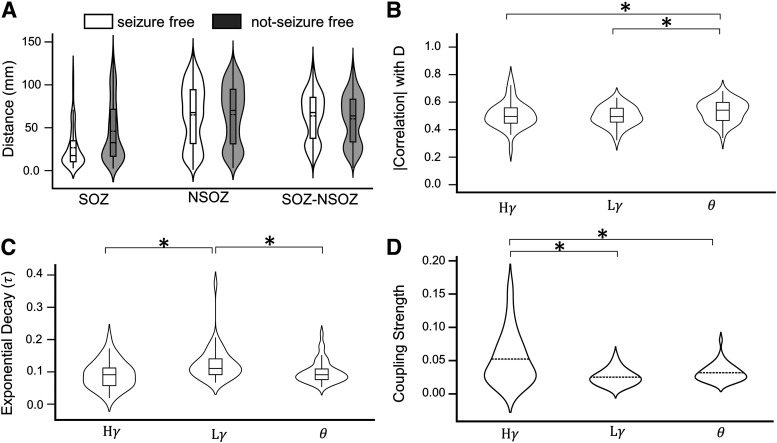
Comparing event connectivity in three frequency bands. A, Violin plots show median Euclidean distance between pairs of contacts in relation to SOZ (abbreviation same as Fig. 2) and seizure outcome for all patients (abbreviation and shading same as Fig. 4). B, Violin and box plots of correlation coefficient between electrode distance and strength of functional coupling in high gamma ), low gamma , and theta frequency bands in all zones and regions. Note that each patient has one correlation value, i.e., the violin plots are for 43 points each. C, The decay constant ( ) of the exponential decay model [EC = A*exp(- *d)] relating the variation of event coupling strength (EC) of different frequency bands ( , , ) with the distance (d) between channels is illustrated in form of violin plots each representing 43 patients. See Extended Data Figure 6-1, which illustrates the difference between slow and fast decays. D, Coupling strength for , , and are compared; p < 0.05 denoted by asterisks (*).

