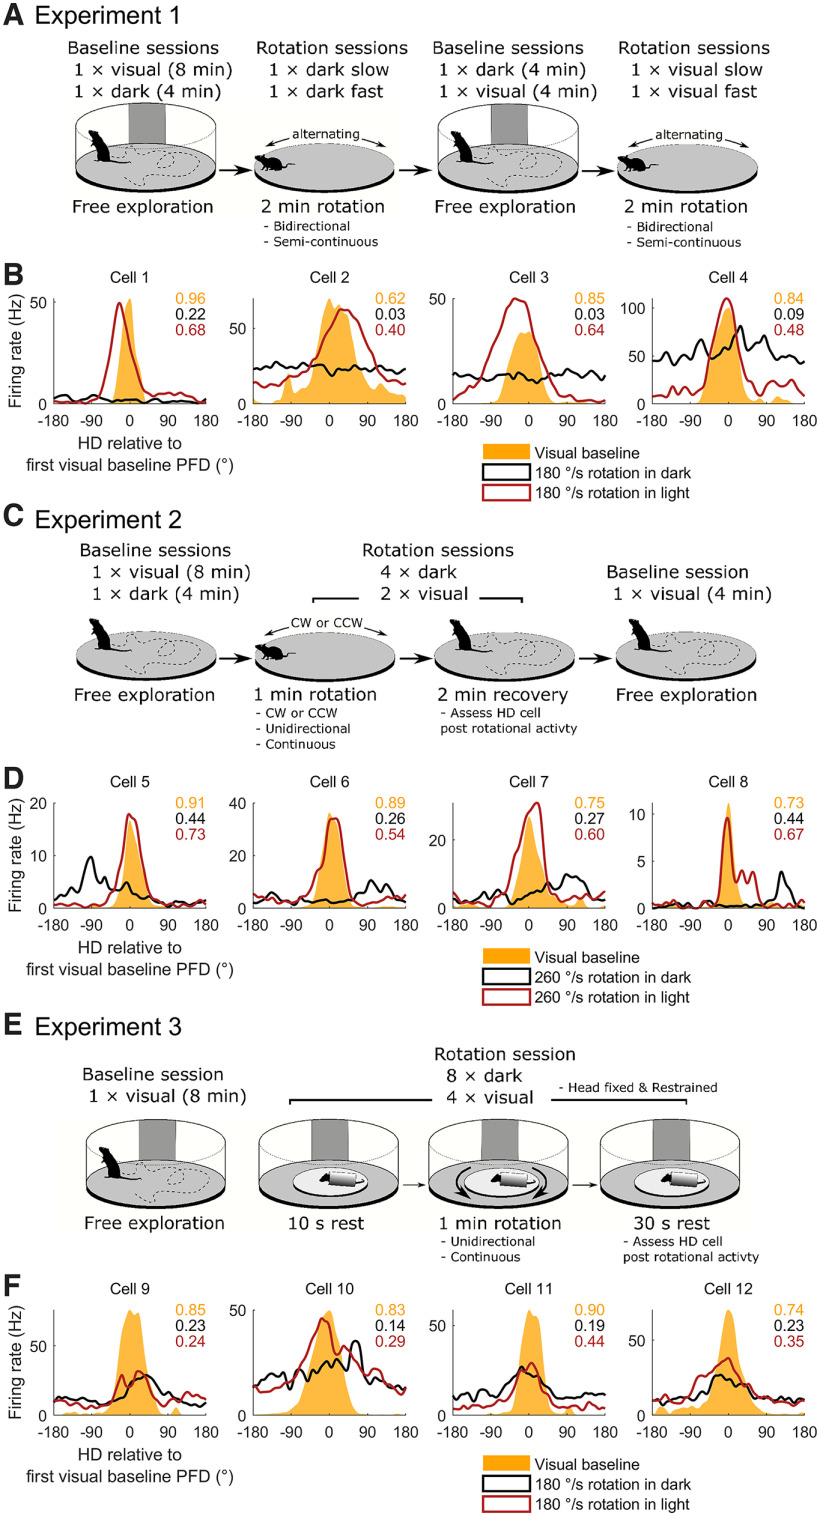
Figure 1.
Design of Experiments 1–3 and example cells. A summary of the sessions recorded for each rat and cell is shown in Extended Data Figure 1-1. Visual = sessions conducted under illumination, dark = sessions conducted in darkness and while rats were blindfolded. CW = clockwise, CCW = counterclockwise, PFD = preferred firing direction. A, Recording protocol for Experiment 1. Slow rotations were performed at 111°/s, fast rotations at 195°/s. Average rotation speeds for all three experiments can be seen in Extended Data Figure 1-2. B, Tuning curves for four example cells recorded in a baseline session with the lights on (yellow shaded curve) a rotation session in the dark (black curve) and a rotation session in the light (red curve). The x-axis is normalized so that an angle of zero denotes the cell’s PFD in the visual baseline session. Top right text gives the Rayleigh vector length for the tuning curve of the same color. HD cell baseline tuning curves for all three experiments can be seen in Extended Data Figures 1-3, 1-4, and 1-5, respectively. C, D, Same as A, B but for Experiment 2. All rotations in this experiment were performed at 260°/s. E, F, Same as A, B but for Experiment 3. All rotations in this experiment were performed at 180°/s. Representative histology for all three experiments can be seen in Extended Data Figure 1-6.

