Figure 2.

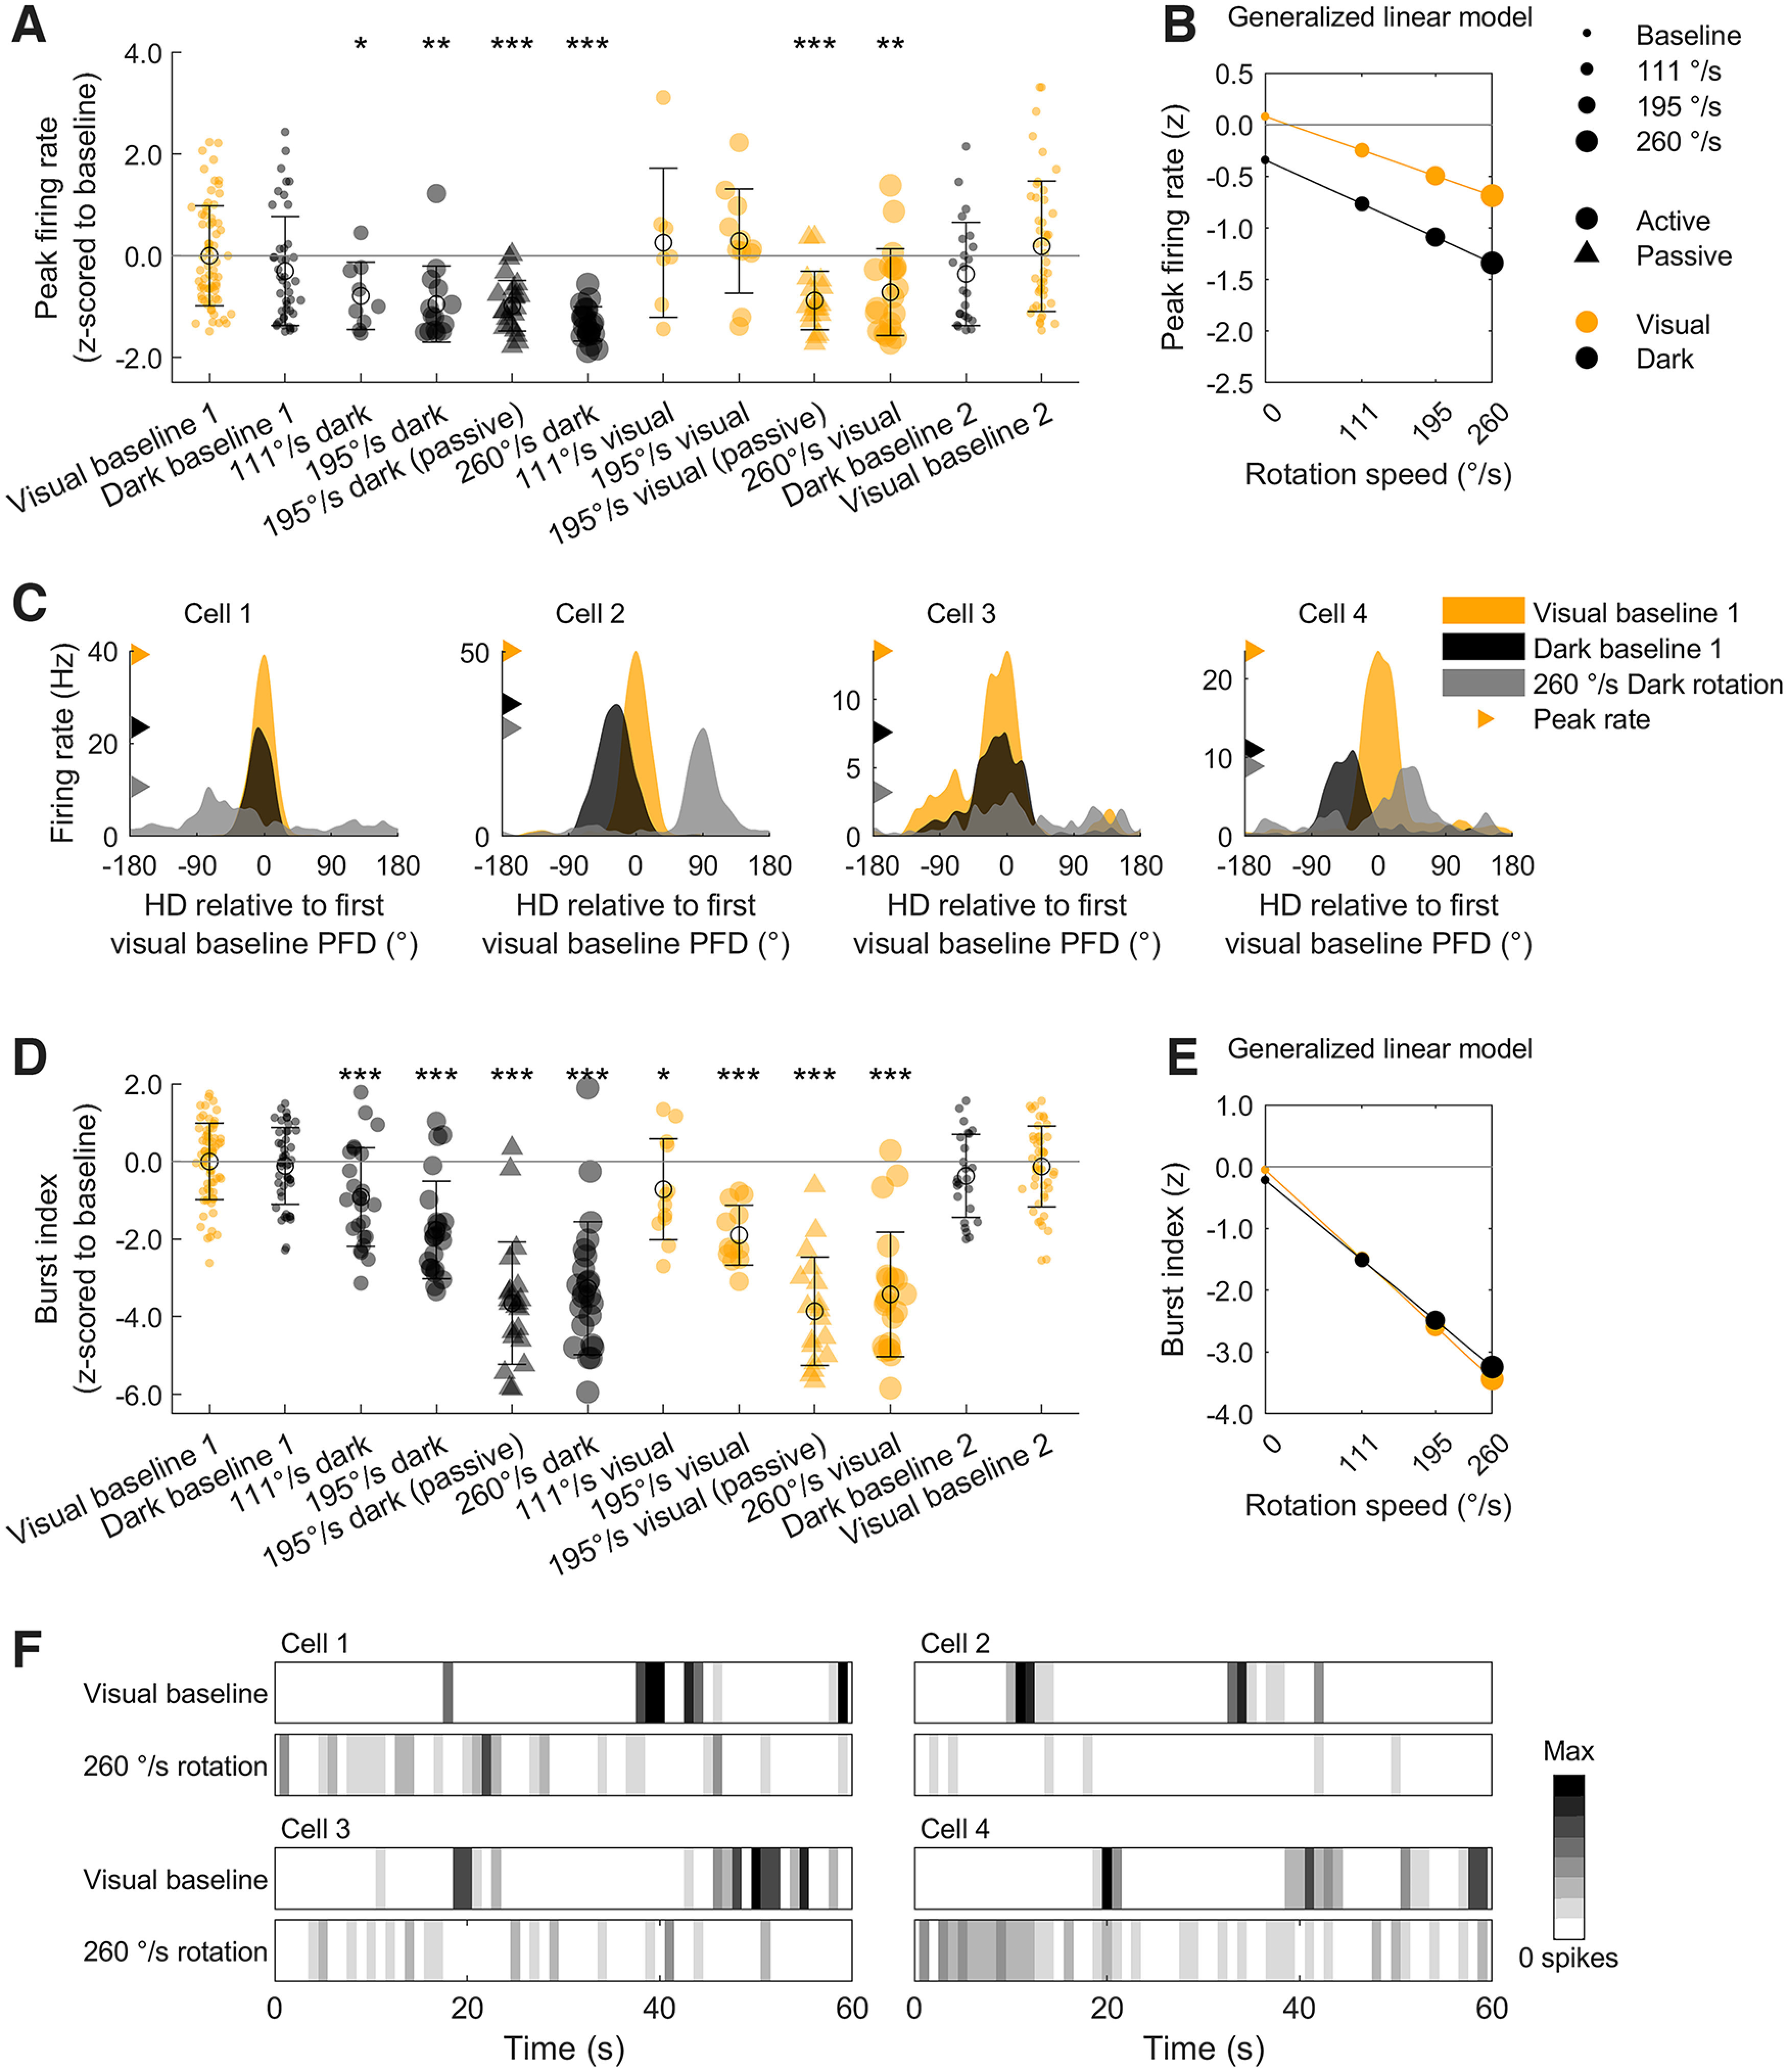
Peak firing rate and burst index decreased during rotations. For panels A and D, group n = 71, 48, 25, 25, 23, 23, 25, 25, 23, 23, 25, 48. A, Peak firing rates for all HD cells in every experimental condition (see legend on far right). Values are z-scored relative to the first visual baseline session in each experiment. Zero denotes the mean baseline value and values less than zero indicate a drop from baseline. Top text shows the result of Holm–Bonferroni corrected t tests comparing each group to the first visual baseline session (*p < 0.05, **p < 0.01, ***p < 0.001). Raw directional and spiking values, compared within experiments, can be seen in Extended Data Figure 2-1. B, The linear relationship between rotation speed, darkness, and peak firing rate (for a hypothetical animal that is actively locomoting and rotating unidirectionally), extracted from a GLM fit to the data in A. AHV modulation does not explain the effects shown here (Extended Data Fig. 2-2). C, Tuning curves for four HD cells that showed a decreased peak firing rate in the fastest rotation condition (260°/s) compared with the baseline sessions. PFD = preferred firing direction. D, E, Same as A, B but for burst index. F, Spike histograms for four HD cells in a visual baseline session (top) and during the fastest rotation condition (bottom; 260°/s). Cell histograms are scaled to the same color axis. Spikes in the visual baseline sessions group together in bursts (dark bands separated by empty bins) more than those during rotation.
