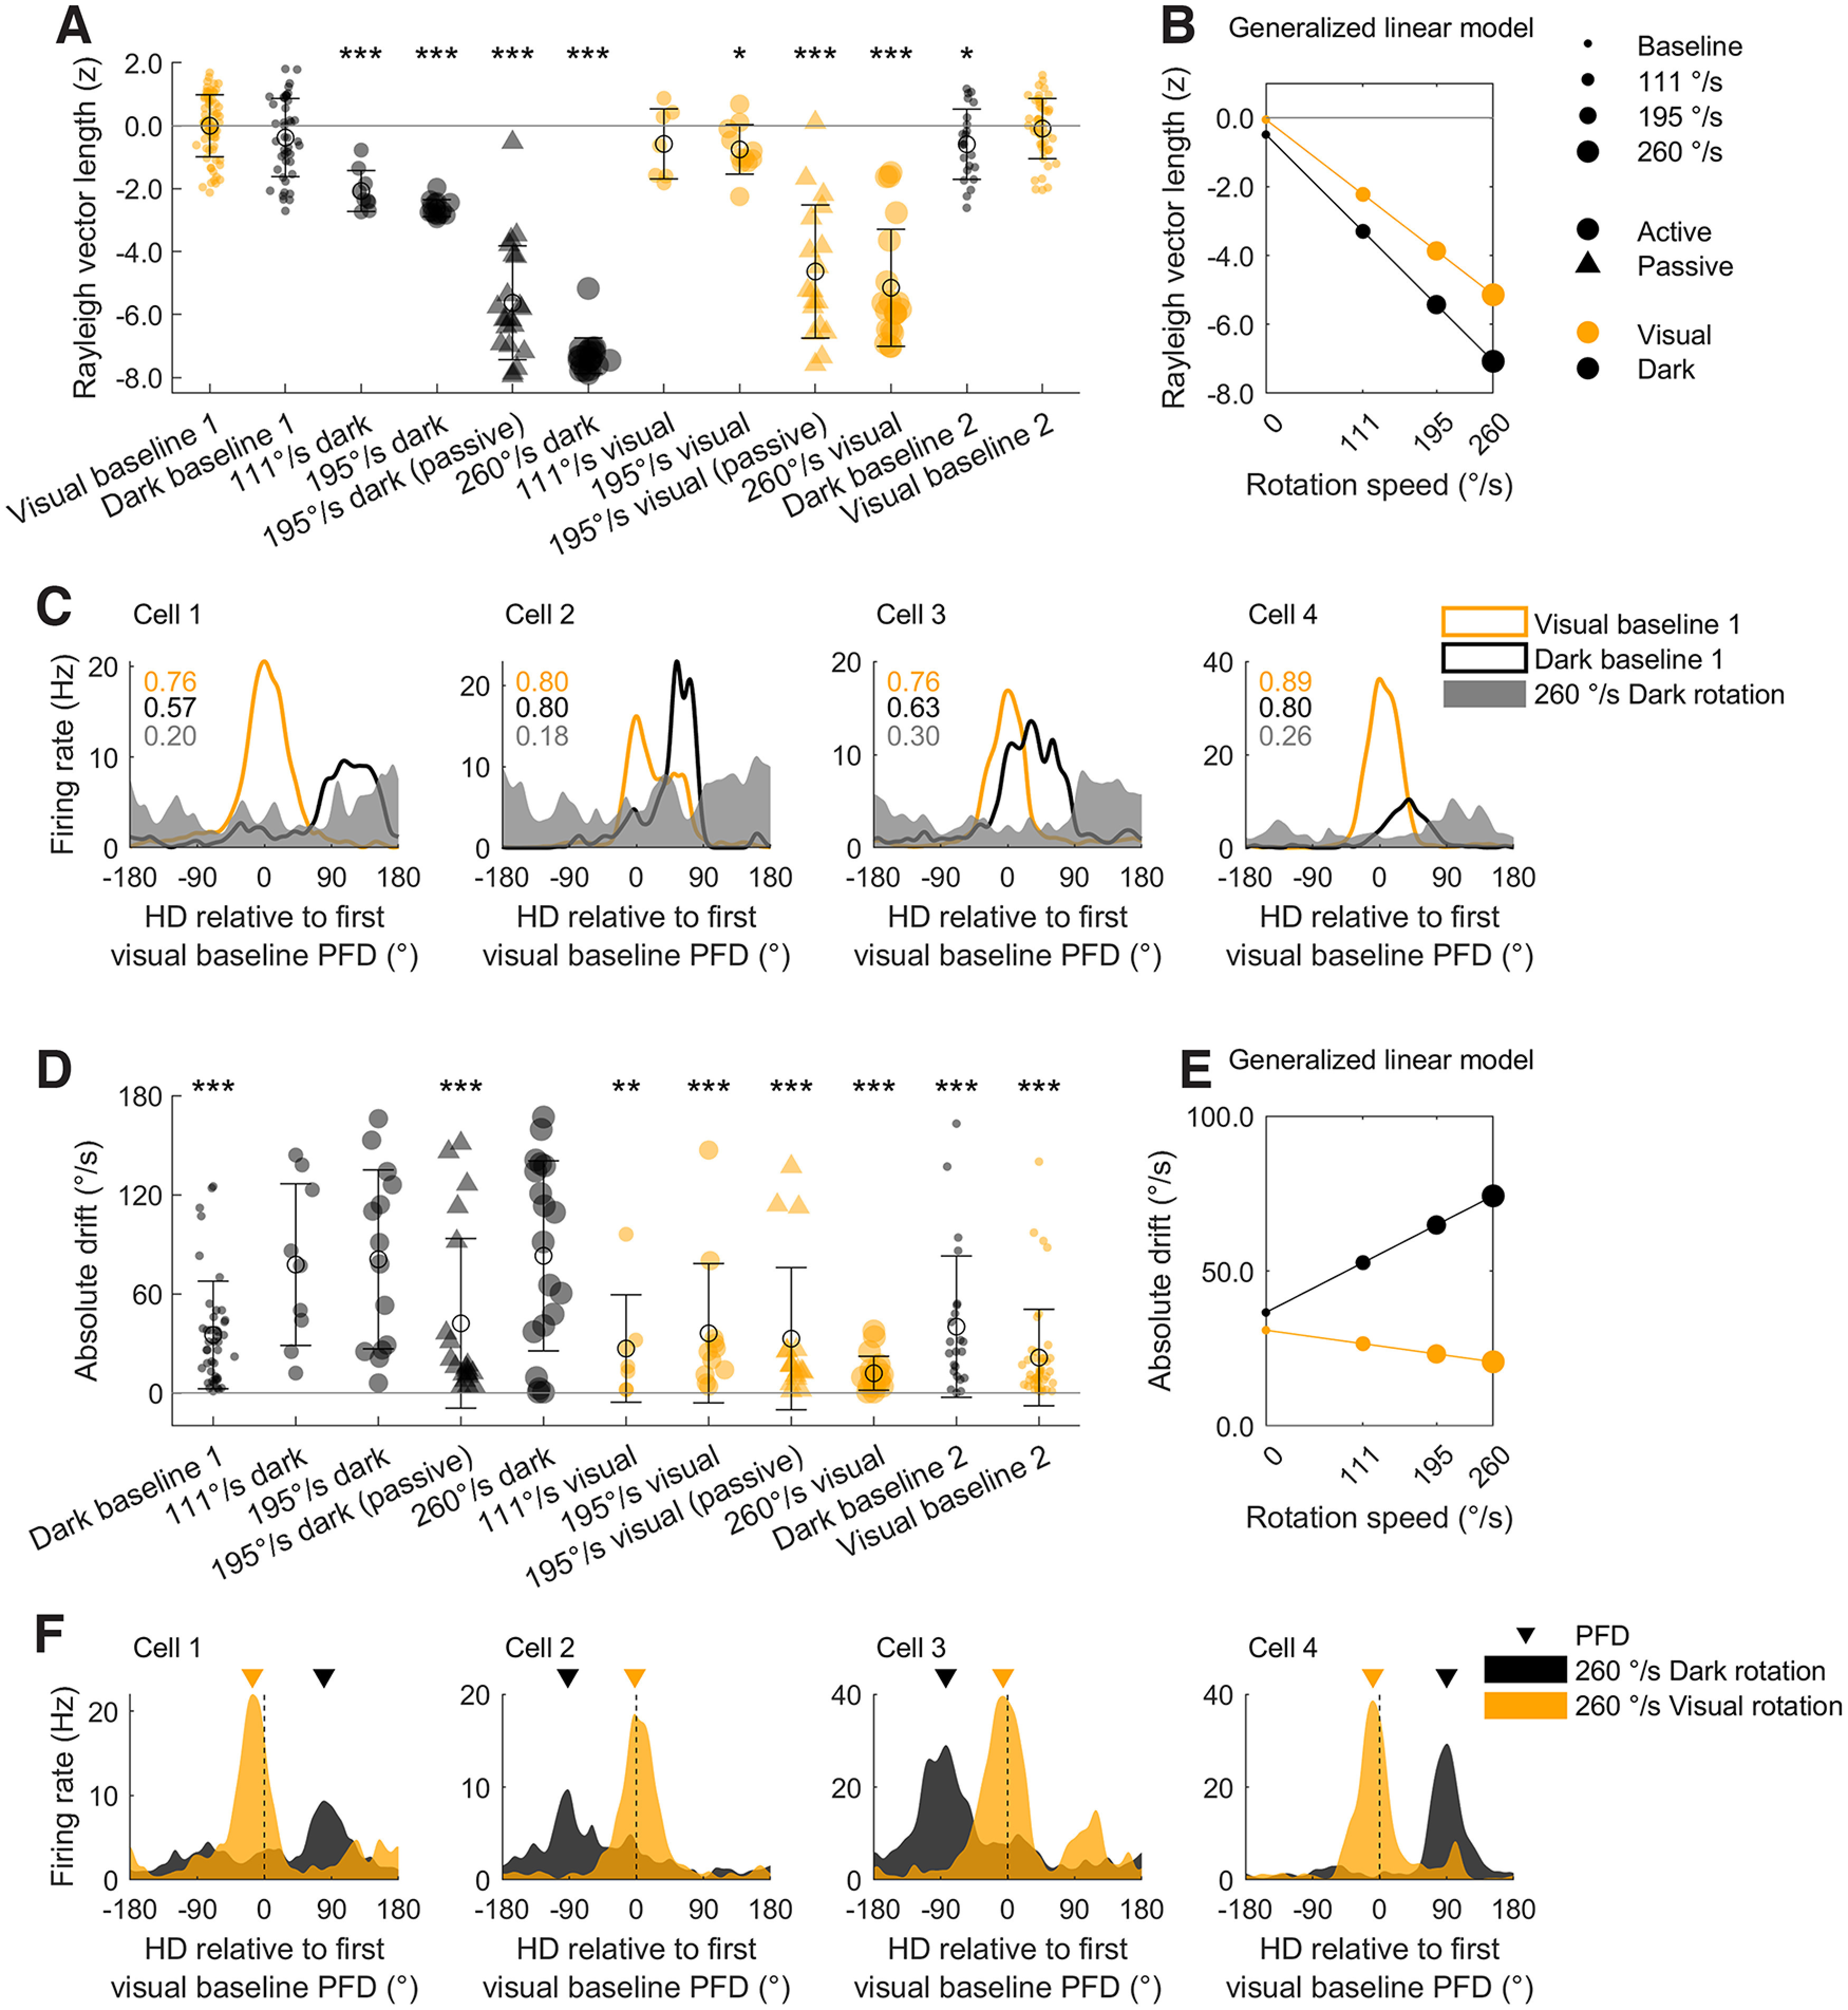
Figure 3.

Directionality and stability decreased during rotations. For panels A and D, group n = 71, 48, 25, 25, 23, 23, 25, 25, 23, 23, 25, 48. A, Directionality (Rayleigh vector length) for all HD cells in every experimental condition (see legend on far right). Values are z-scored relative to the first visual baseline session in each experiment. Zero denotes the mean baseline value and values less than zero indicate a decrease from baseline. Top text shows the result of Holm–Bonferroni corrected t tests comparing each group to the first visual baseline session (*p < 0.05, **p < 0.01, ***p < 0.001). B, The linear relationship between rotation speed, darkness, and directionality (for a hypothetical animal that is actively locomoting and rotating unidirectionally), extracted from the GLM fitted to the data in A. C, Tuning curves for four HD cells that showed decreased directionality in the fastest rotation condition (260°/s) compared with the baseline sessions. PFD = preferred firing direction. D, Same as A but for absolute drift: the absolute difference in angle between a cell’s PFD and its PFD in the first visual baseline. Text gives the result of Holm–Bonferroni corrected V-tests for nonuniformity around a mean direction of 0°, a significant value here denotes clustering around 0° and thus a stable PFD. For all three experiments, raw drift values, and their development within sessions, can be seen in Extended Data Figures 3-1 and 3-2. E, Same as B but for absolute drift. F, Tuning curves for four HD cells during fast rotations (260°/s) in the light and dark. The x-axis is normalized so that an angle of zero denotes the cell’s PFD in the first visual baseline. In the light, cells maintain a PFD close to their baseline angle, whereas in the dark, their PFDs drift more readily. In Experiment 2, the angle between co-recorded tuning curves was generally consistent, suggesting that HD cells maintained coherence (Extended Data Fig. 3-3).
