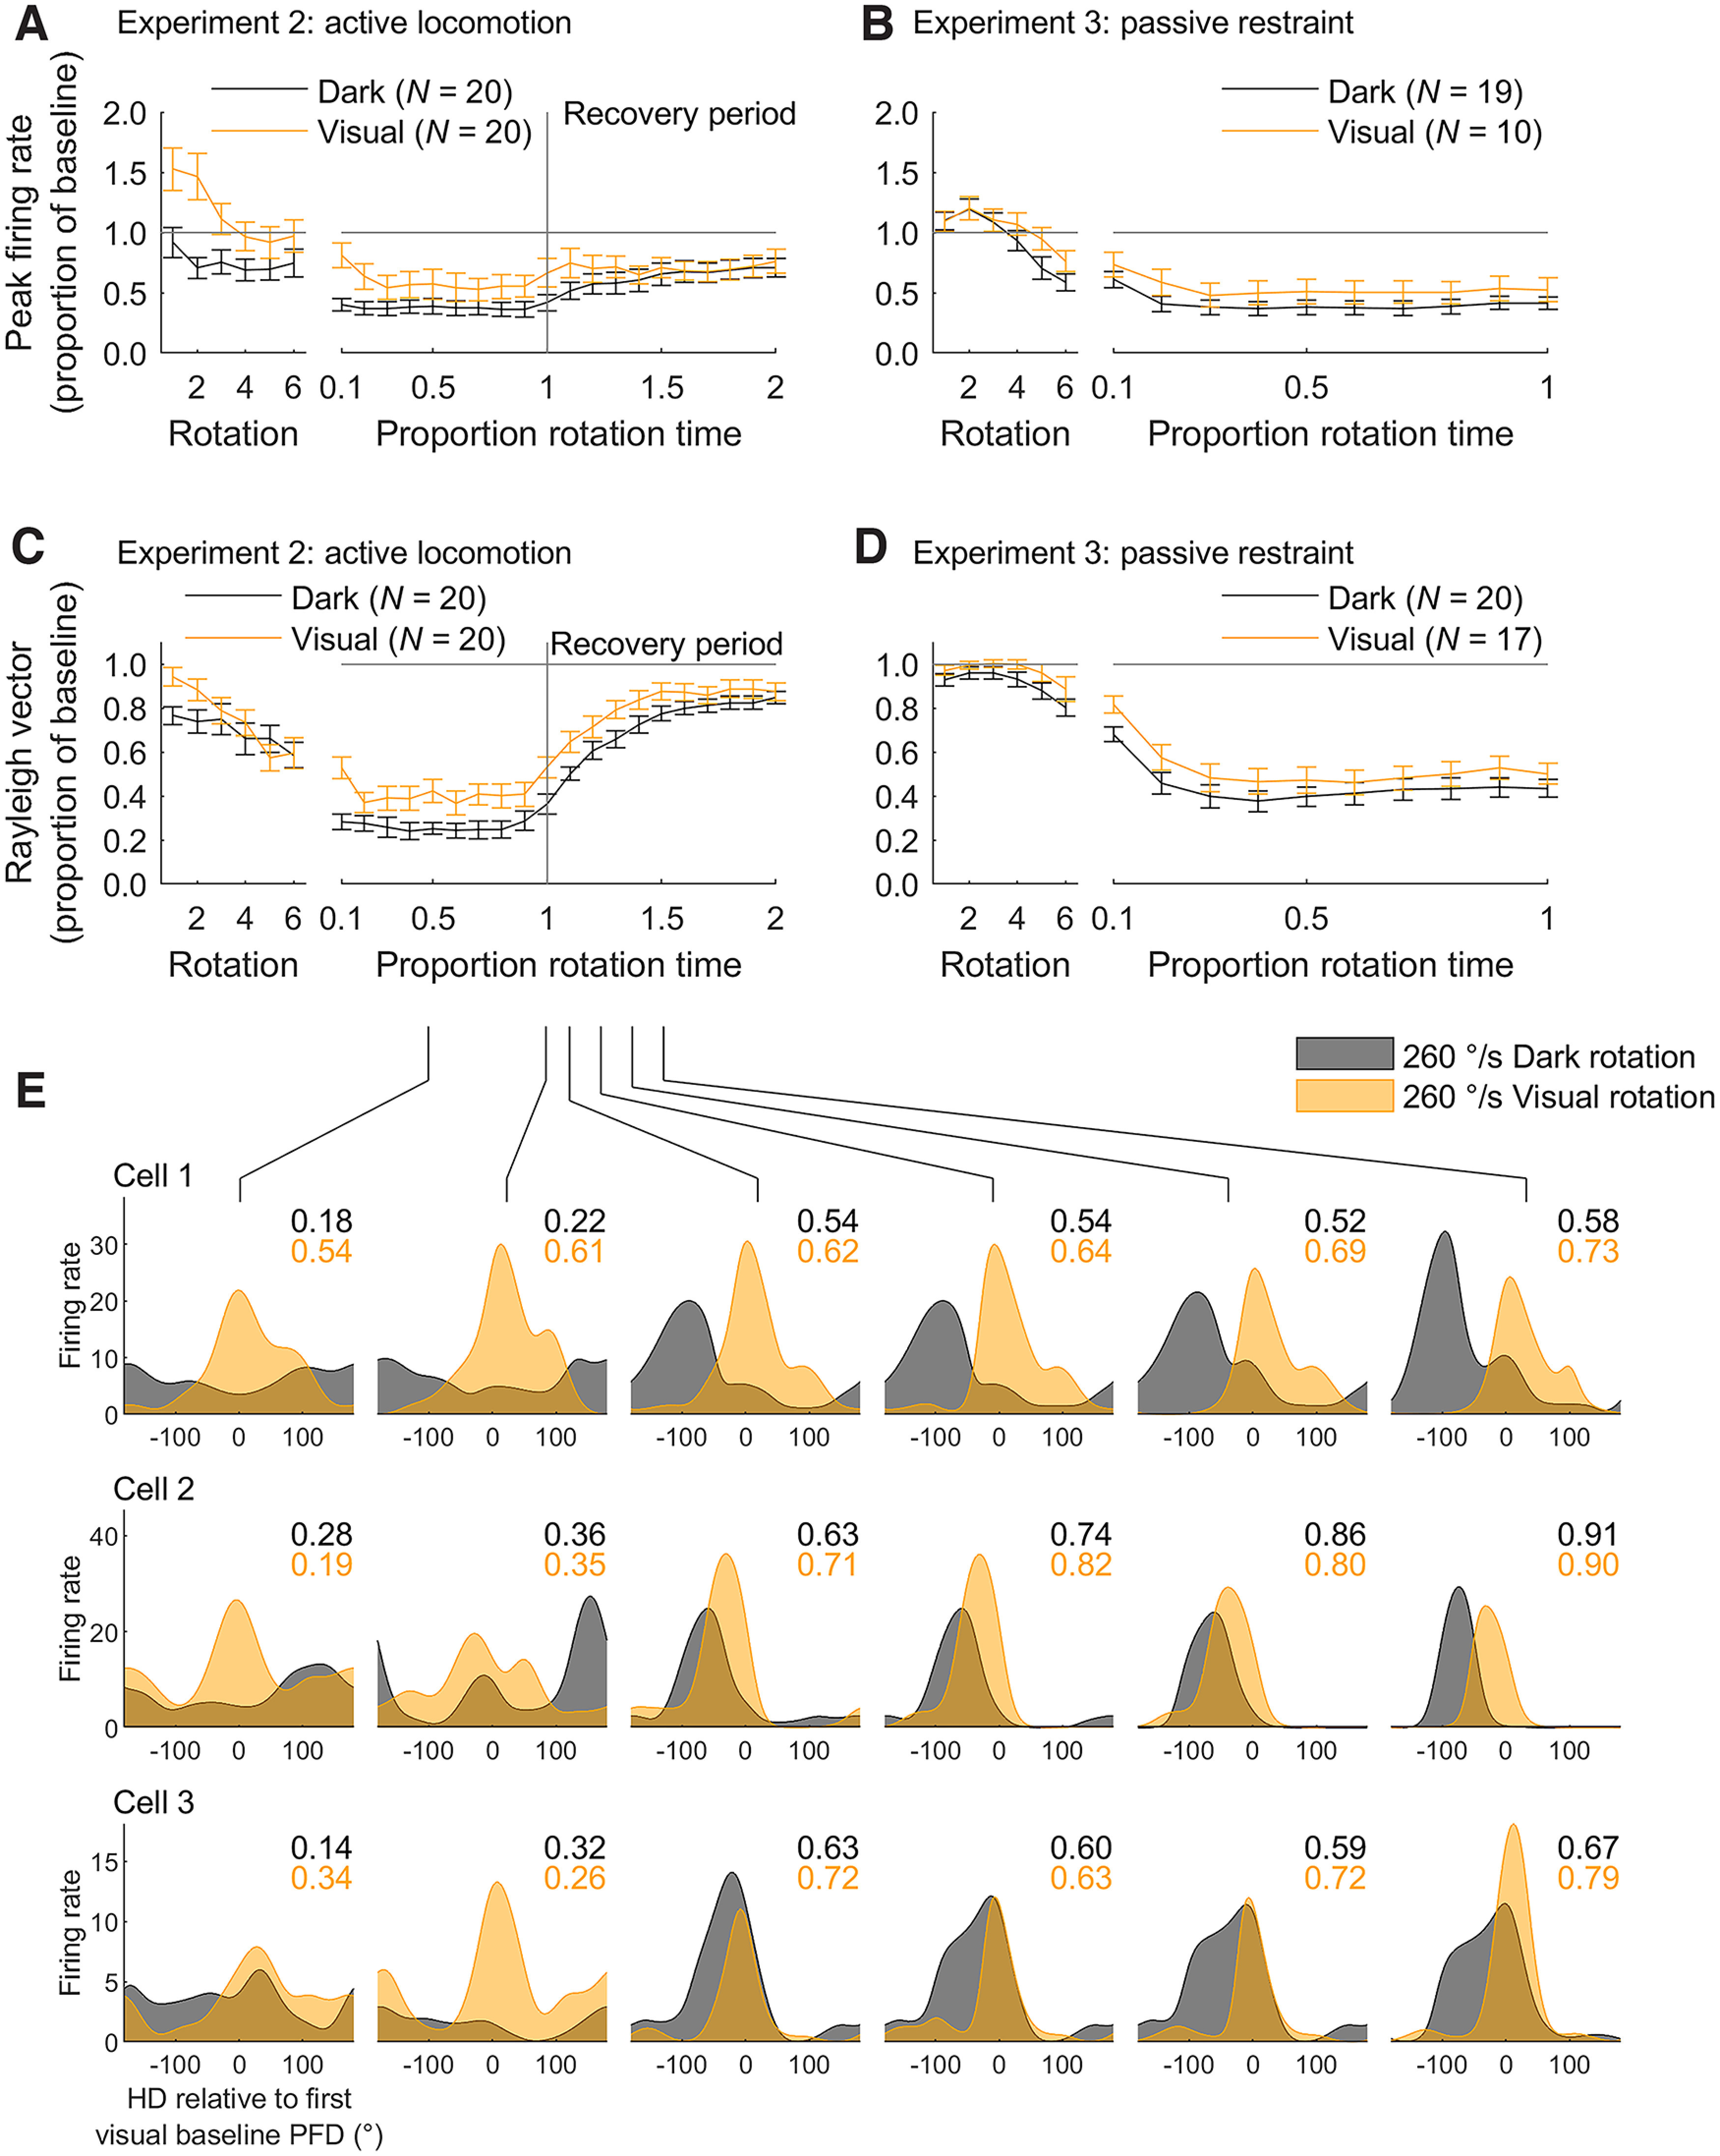
Figure 4.

Peak firing rates and directionality recovered after rotations. A, Mean ± SEM peak firing rates in Experiment 2 (active locomotion) throughout rotations, expressed as a proportion of the peak firing rate observed in the first visual baseline session. Left axis shows values for the first six rotations. Right axis shows values for the remaining session (10% of rotation period onwards) calculated using a sliding window (see Materials and Methods, Windowed tuning curves and parameters). The total length of the rotation period was 1 min. When a cell was recorded in multiple sessions, the responses were averaged to provide one value per cell. B, Same as A but for Experiment 3 (passive restraint). The total length of the rotation period was also 1 min. C, D, Same as A, B but for directionality. E, Tuning curves for three example HD cells, one per row, in the fastest rotation condition (260°/s), in the light and dark. PFD = preferred firing direction. Tuning curves were calculated for nonoverlapping 10-s windows at selected time points throughout the rotation period. Values shown in the upper right corner of each plot are the Rayleigh vector length of the tuning curve with the corresponding color. Directionality is generally higher in the visual rotation sessions but following rotation directionality recovers at a similar speed in light and dark sessions.
