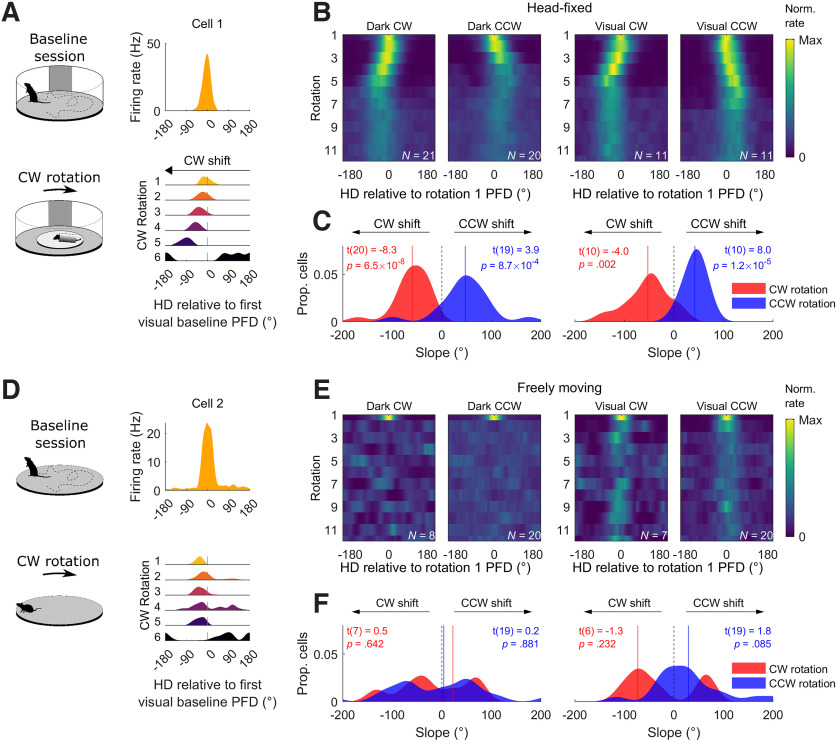
Figure 5.
HD cells underestimated angular head velocity in head-fixed sessions. A, Top, Example tuning curve for the first visual baseline. Bottom, Tuning curves for the same cell during the first six rotations in a dark CW rotation session. Angles are normalized such that 0° is the PFD in the first baseline session. PFDs shift in the direction of rotation (leftward for CW). B, Sum normalized tuning curves for the first 12 rotations for all cells (averaged across sessions then cells). Angles are normalized such that 0° is the PFD in the first rotation. C, Circular-linear regression slopes fitted to the PFDs in the first six rotations for all cells. Left plot shows results for dark sessions, right plot shows results for visual sessions. Slopes were negative for CW rotations and positive for CCW rotations indicating that PFDs shifted in the direction of rotation. Vertical colored lines denote distribution means, statistical values show the result of a one-sample t test comparing the group mean to zero. D–F, Same as A–C but for sessions where animals were actively locomoting. Note that the tuning curve shift is absent for these sessions.

