Figure 7.
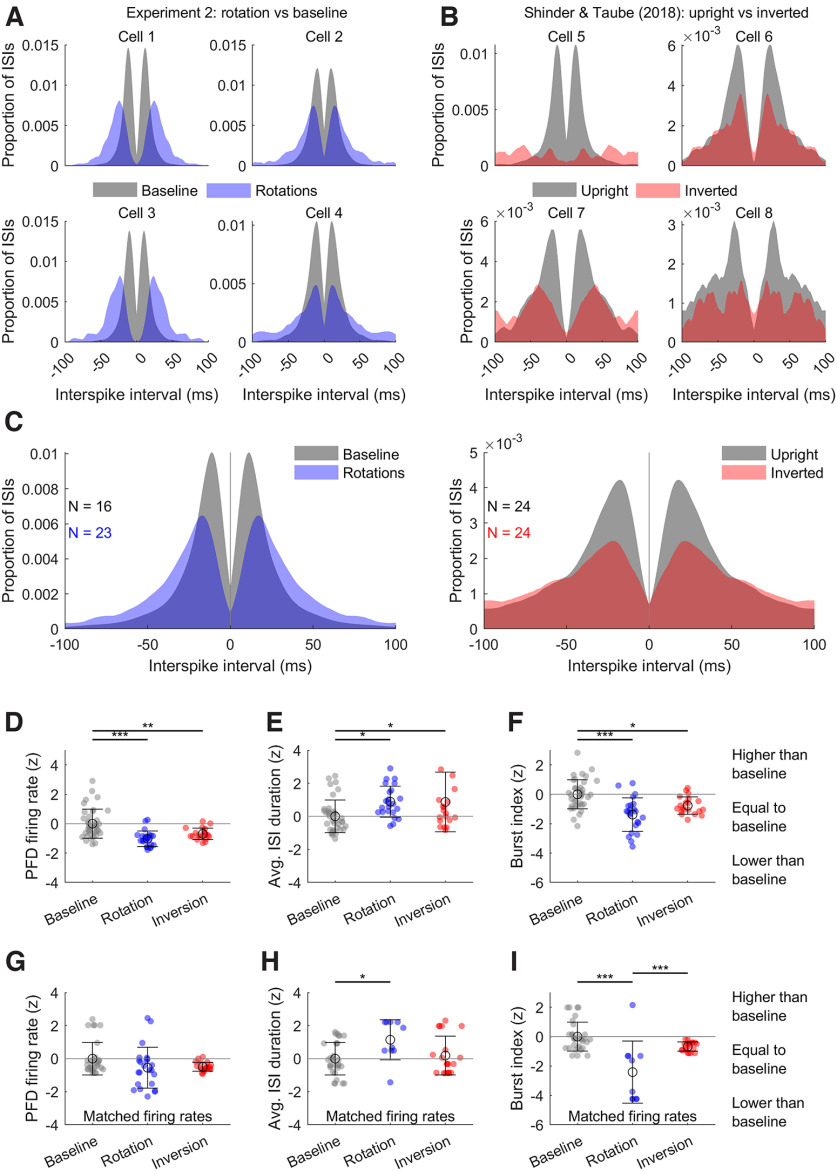
Rotation and inversion share similar effects on HD cells. See Materials and Methods, Rotation and inversion comparisons. A, Histograms showing the distribution of interspike intervals (ISIs) during baseline and rotation sessions in Experiment 3, for four example cells. During baseline sessions rats actively locomoted in an open arena; during rotations rats were head-fixed and restrained. Only spikes emitted within ±30° of the cell’s PFD are included. B, Same as A but for four example cells recorded while restrained, head-fixed rats faced a HD cell’s PFD for 30 s either upright or inverted (upside down). Data are from Shinder and Taube (Shinder and Taube, 2019). C, Same as A, B but showing the distribution of interspike intervals (ISIs) averaged across sessions and then cells. D–I, In each case, data were z-scored relative to corresponding baseline values. Colored markers represent cells; when multiple sessions were recorded per cell, values were averaged across sessions. Empty circles denote group mean, error bars denote SEM. Tests are one-way ANOVAs; the statistical significance of post hoc tests is shown by horizontal brackets and asterisks above the plots (*p < 0.05, **p < 0.01, ***p < 0.001). D, HD cell PFD firing rates when rats were rotated or inverted. Groups differed significantly (n = 39, 23, 20; F(2,79) = 14.3, p = 4.9 × 10⁻⁶, = 0.27). E, Same as D but for average ISI duration. Groups differed significantly (n = 39, 23, 20; F(2,79) = 5.3, p = 7.0 × 10⁻³, = 0.12). F, Same as D, but for burst index; the proportion of ISIs <25 ms. Groups differed significantly (n = 39, 23, 20; F(2,79) = 15.7, p = 1.9 × 10⁻⁶, = 0.28). G–I, Same as D–F, but groups are matched to baseline sessions in terms of PFD firing rate before normalization. H, Groups differed significantly (n = 32, 10, 20; F(2,81) = 6.3, p = 2.8 × 10⁻³, = 0.38). I, Groups differed significantly (n = 32, 10, 20; F(2,81) = 24.7, p = 4.3 × 10⁻⁹, = 0.28).

