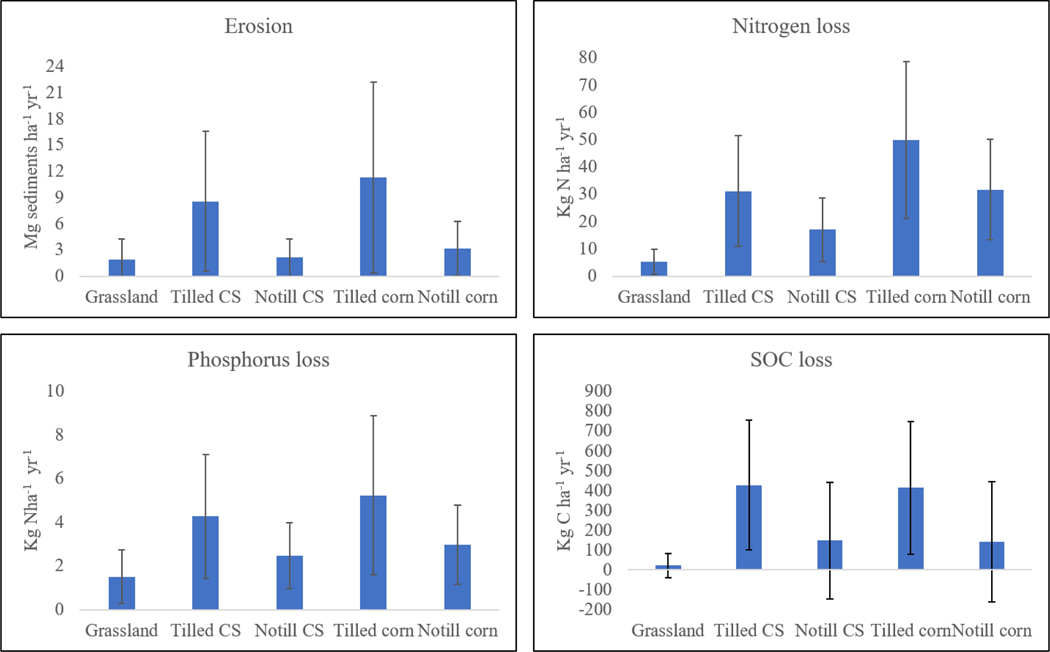
Figure 3.
Environmental impacts of cropland expansion scenarios across the converted parcels within the 12-state region, expressed on a per unit area basis. Whiskers represent ± 1standard deviation from the mean value. Corn-soybeans abbreviated CS. Grassland represents the baseline scenario (i.e., the effects if converted parcels had remained in grassland cover). Note: Negative SOC values reflect soil C accrual.

